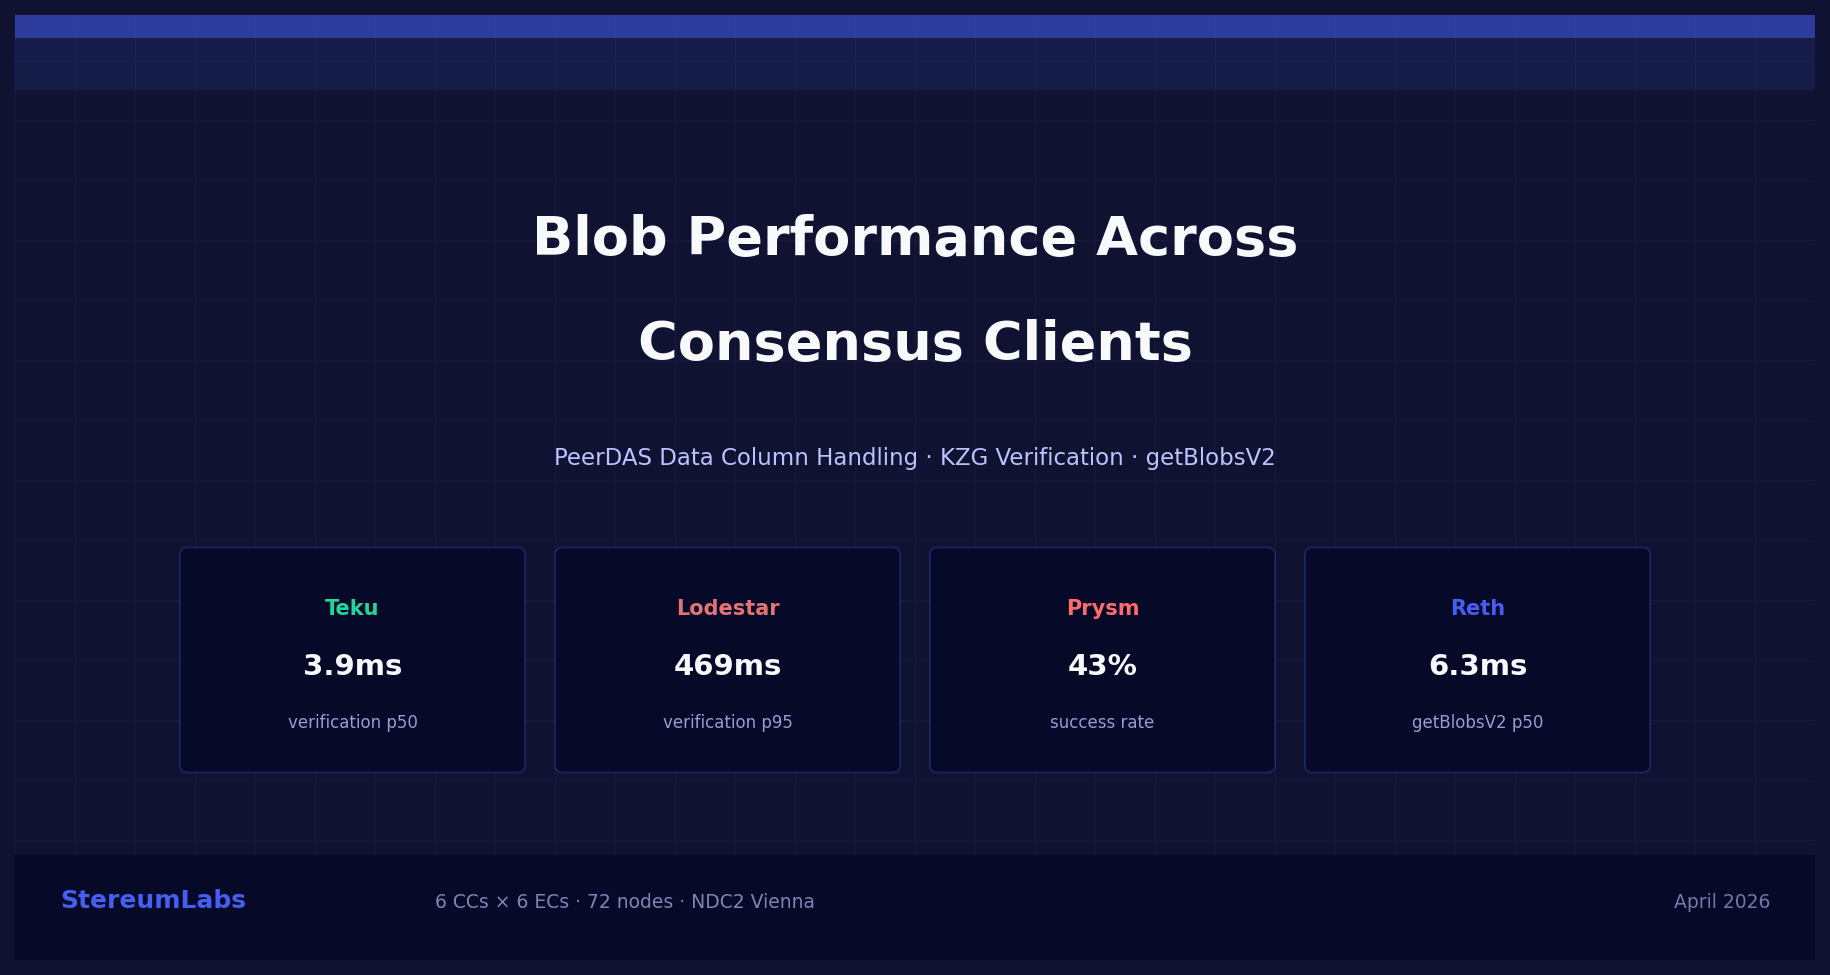
Blob performance across consensus clients


We measured gossip verification, KZG batch verification, data column reconstruction, and getBlobsV2 latency across 72 nodes running all six consensus clients. The verification speed spread between fastest and slowest client: 50x.
What are blobs?
Blobs (Binary Large Objects) are a data type attached to Ethereum transactions, introduced with EIP-4844 ("Proto-Danksharding") and expanded with the Fusaka hardfork (December 2025), which activated PeerDAS (Peer Data Availability Sampling).
Before blobs, Layer 2 rollups posted their transaction data into execution layer calldata, competing for the same gas as every other transaction. Blobs created a separate, cheaper data channel for rollup data. Each blob carries about 128 KB and lives on the consensus layer (beacon chain), not in execution layer state, so it does not permanently bloat the blockchain.
From blobs to data columns: PeerDAS
Fusaka took this further with PeerDAS. Instead of every node downloading every full blob, blobs are split into 128 data columns via erasure coding. Each node only needs to custody a few of these columns, typically 4 custody groups for a standard node. This reduces bandwidth requirements while maintaining data availability guarantees through KZG commitments (mathematical proofs). We measured the hardware impact of PeerDAS on our fleet in a separate post.
The lifecycle of a blob under PeerDAS:
- A rollup submits a transaction with blob data attached
- The execution client receives the transaction and holds the blob in its blob pool
- At block proposal time, the consensus client can fetch blobs from its local EC via the
getBlobsV2Engine API call - After the block is published, nodes verify the data column sidecars they receive via gossip, including KZG proof and inclusion proof verification
- If a node does not receive all its custody columns via gossip in time, it can attempt reconstruction from the columns it does have (if it has enough)
Each of these steps has measurable performance characteristics, and they vary across consensus client implementations. That is what we measured.
Blobs and MEV-Boost
Most validators today use MEV-Boost to outsource block building to external builders who compete on profitability. Blob transactions carry their own fee market (blob gas), so builders have an incentive to pack as many blob transactions as possible into their blocks.
When a validator proposes a block via MEV-Boost, the flow adds a step: the CC receives a blinded block from the relay, reveals it, and then gets the full execution payload including all blobs. The CC must then compute and broadcast all data column sidecars from these blobs before the attestation deadline. This means the proposer's CC must have full data availability (all 128 custody groups) to serve the data column sidecars. If the CC is slow at blob processing, the block's data columns reach the network late, which increases the chance of missed attestations by other validators who depend on timely gossip.
In practice, MEV-Boost blocks tend to be blob-heavy because builders optimize for maximum gas revenue. A CC that handles blobs well under normal conditions but degrades at 6 blobs per slot will perform worse on MEV-Boost blocks than on locally built blocks.
Test setup
Our StereumLabs fleet at the NDC2 datacenter in Vienna, Austria runs all six major consensus clients, each paired with all six major execution clients: 72 nodes total (36 CC×EC pairings on bare metal, plus 6 GCP-hosted supernodes not covered here). Each CC is connected to a validator client that assigns validator duties. The validator clients themselves are not part of the StereumLabs metrics pipeline, but their effect is visible indirectly: because validators are attached, every CC should operate as a supernode (128 custody groups) to guarantee full data availability for block proposals. Whether each CC actually does this is one of the things we checked. For details on methodology and infrastructure, see the StereumLabs documentation. The fleet is operated by RockLogic GmbH.
Observation window: April 24, 2026, 11:00 to 12:00 UTC. All histogram percentiles and rates in this post are computed over this 1-hour window. Counter-based totals (like getBlobsV2 request counts) are cumulative since last process restart. Longer time ranges and historical comparisons can be explored directly on the StereumLabs dashboards. If you need a custom analysis or report for a specific time range, client pairing, or metric, reach out to us at contact@stereumlabs.com.
| Consensus Client | Version | Execution Clients |
|---|---|---|
| Grandine | 2.0.4 | Besu, Erigon, Ethrex, Geth, Nethermind, Reth |
| Lighthouse | v8.1.3 | Besu, Erigon, Ethrex, Geth, Nethermind, Reth |
| Lodestar | v1.41.1 | Besu, Erigon, Ethrex, Geth, Nethermind, Reth |
| Nimbus | v26.3.1 | Besu, Erigon, Ethrex, Geth, Nethermind, Reth |
| Prysm | v7.1.3 | Besu, Erigon, Ethrex, Geth, Nethermind, Reth |
| Teku | 26.4.0 | Besu, Erigon, Ethrex, Geth, Nethermind, Reth |
All nodes run on identical bare-metal hardware in Vienna. Performance differences reflect client implementation, not infrastructure.
Metrics are averaged across all EC pairings per CC unless otherwise noted. All histograms are computed over a 1-hour rolling window.
Finding 1: Custody groups and the validator client effect
Since every CC on our fleet has a validator client attached, each CC should automatically upgrade to 128 custody groups (full supernode) to ensure complete data availability for block proposals. The question is: do they actually do this?
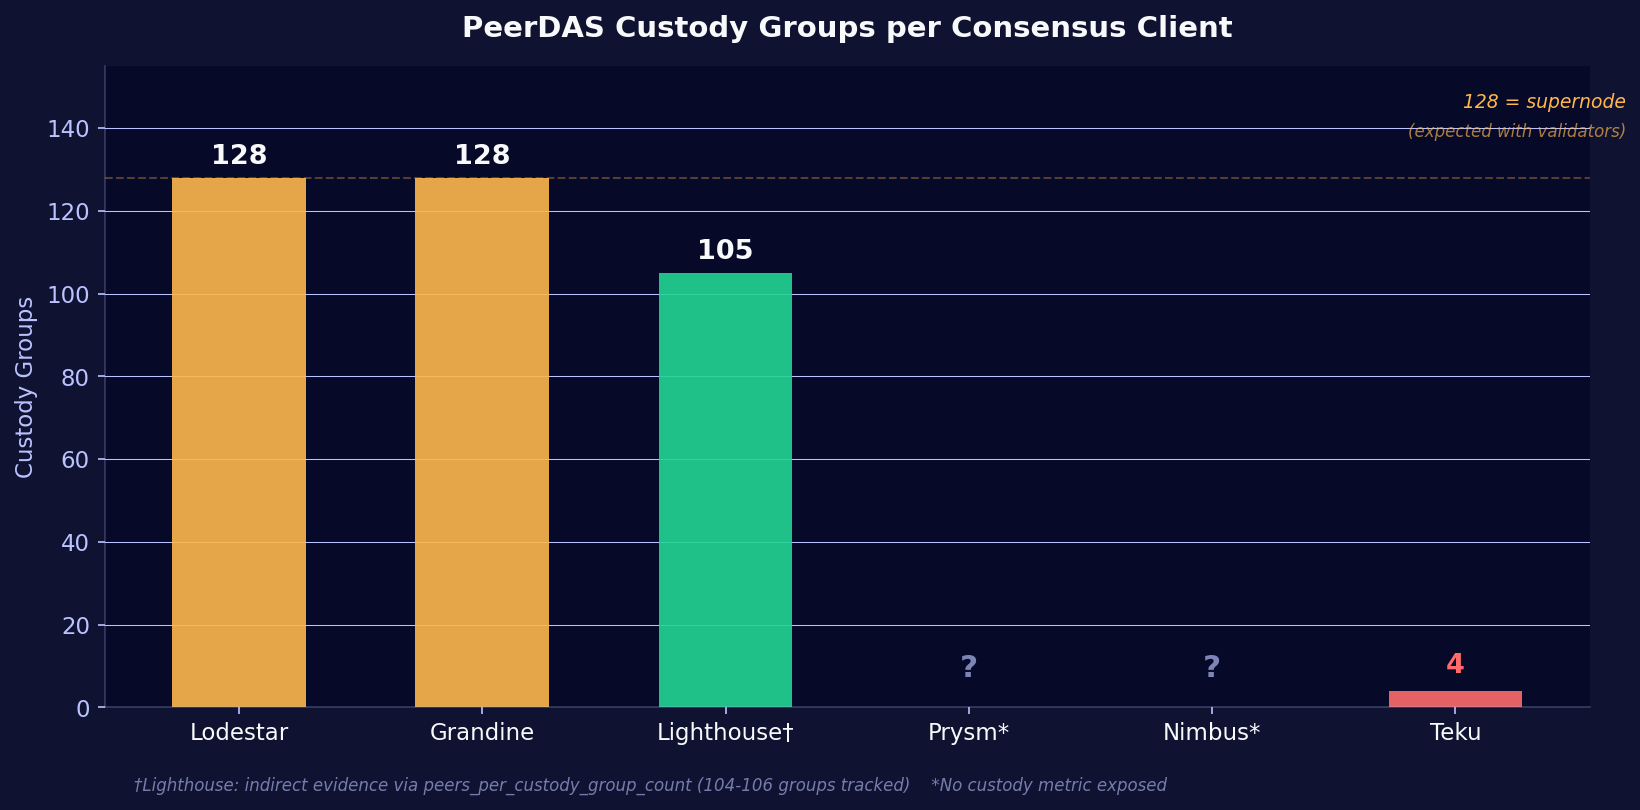
The beacon_custody_groups metric is only exposed by Lodestar, Grandine, and Teku. Lodestar and Grandine both report 128 custody groups, as expected for nodes with validators attached. Teku reports only 4 custody groups across all 6 EC pairings, despite having a validator client connected. This is unexpected and may indicate that Teku 26.4.0 does not auto-upgrade custody group count when validator duties are assigned, or that a separate CLI flag is required.
Lighthouse does not expose beacon_custody_groups, but a different metric tells the story: peers_per_custody_group_count shows Lighthouse tracking 104 to 106 custody groups (out of 128) across all EC pairings. That is consistent with supernode behavior. The missing 22-24 groups likely just have no peers at the moment rather than being uncustodied.
Nimbus and Prysm do not expose any custody-related metrics at all. We cannot confirm their actual custody group count from Prometheus. However, Nimbus's low data column processing rate (0.23 sidecars/s received, comparable to Teku's 0.29 req/s at 4 custody groups) suggests it may also not be running at full supernode level. Prysm's higher processing rate (3.7 req/s) is more consistent with supernode-level traffic, though still lower than Grandine (11.1 req/s) and Lighthouse (7.5 req/s).
The custody group count has a direct impact on everything that follows in this post. A node custodying 128 groups downloads, verifies, and stores 32x more data column sidecars than a node custodying 4 groups. This has to be considered when comparing absolute processing rates and latency tails across clients.
Teku operators with validators attached should verify that their node actually custodies all 128 groups. With only 4 groups, the node may not have full data availability when it needs to propose a block. Check the beacon_custody_groups metric in your Grafana.
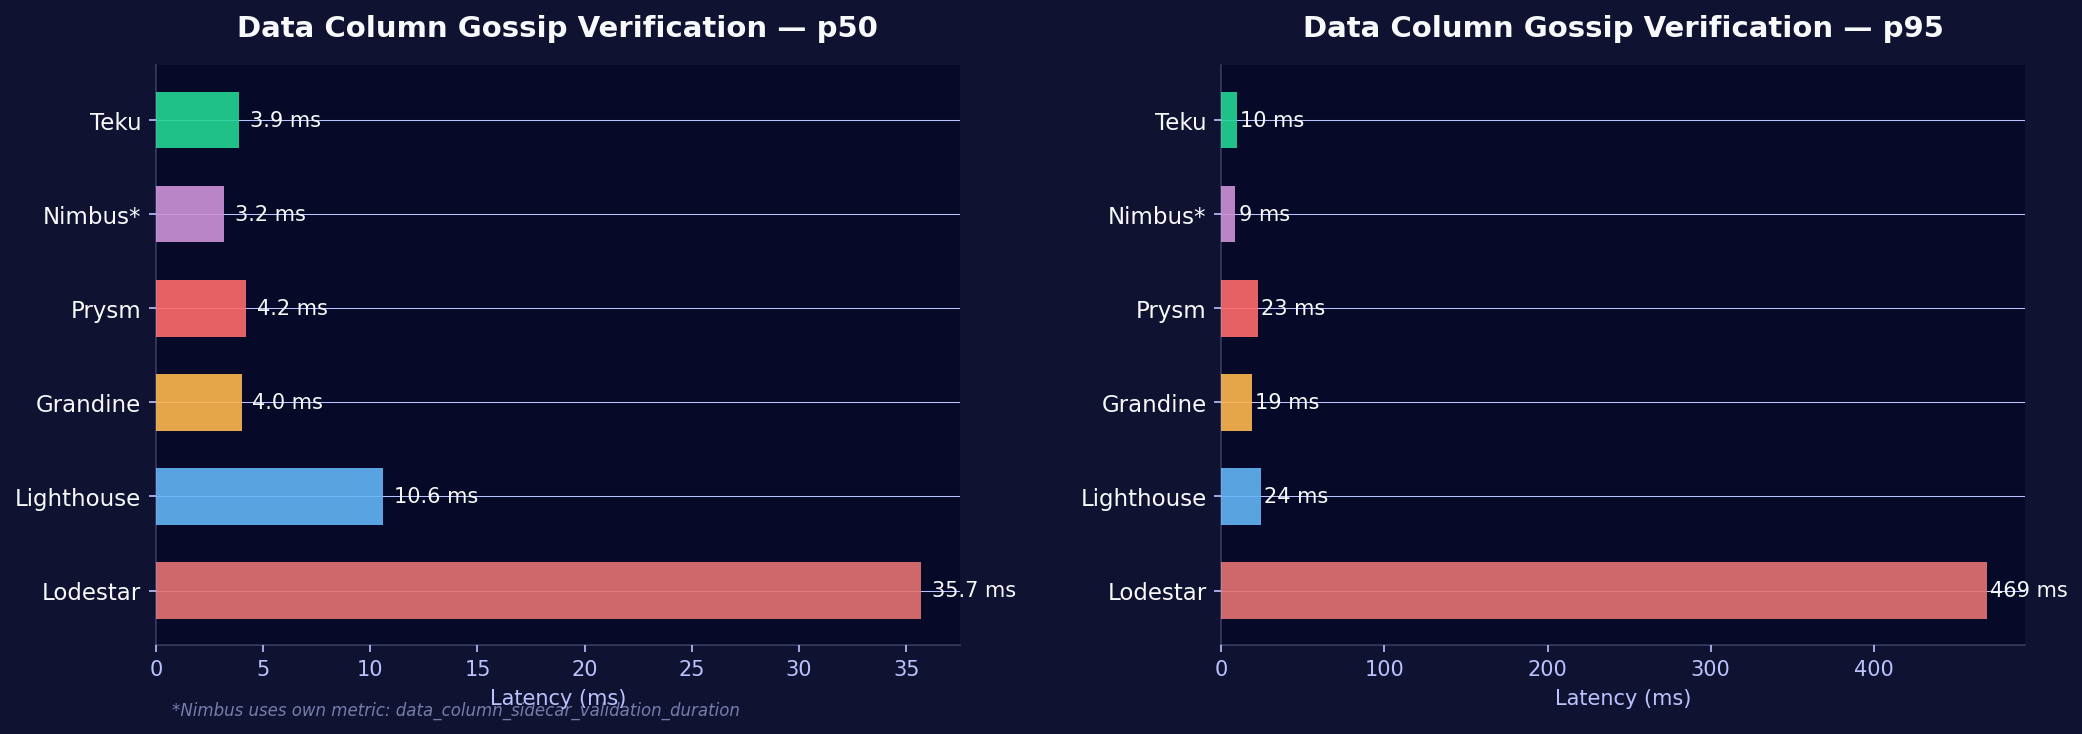
Finding 2: Gossip verification speed varies 50x between clients
When a data column sidecar arrives via gossip, the consensus client must verify it before accepting it. This includes KZG proof and inclusion proof checks. Verification speed determines how quickly a node can process incoming data columns and meet attestation deadlines.
| CC | p50 | p95 | Notes |
|---|---|---|---|
| Teku | 3.9 ms | 9.5 ms | Fastest, tightest distribution |
| Nimbus | 3.2 ms | 8.7 ms | Own metric name* |
| Prysm | 4.2 ms | 22.7 ms | Fast p50, wider tail |
| Grandine | 4.0 ms | 19.0 ms | Despite 128 custody groups |
| Lighthouse | 10.6 ms | 24.2 ms | Middle of the pack |
| Lodestar | 35.7 ms | 469 ms | ~50x slower than Teku at p95 |
Nimbus uses data_column_sidecar_validation_duration rather than the beacon_data_column_sidecar_gossip_verification_seconds metric that other clients expose. The values are not perfectly 1:1 comparable but represent the same operation.
Operator perspective: At p95, Lodestar takes nearly half a second to verify a single data column. In a blob-heavy slot with 6 blobs (which expand to many data columns), this verification backlog can delay attestation timing. Attestations need to be published within the first 4 seconds of a slot, and each 469ms verification eats into that window.
Researcher perspective: Lodestar is the only consensus client written in TypeScript/Node.js. The cryptographic operations (KZG proofs, hash computations) are heavily optimized in compiled languages: Rust for Lighthouse/Grandine, Go for Prysm, Java with JNI for Teku, Nim for Nimbus. A JIT-compiled runtime faces a hard ceiling here.
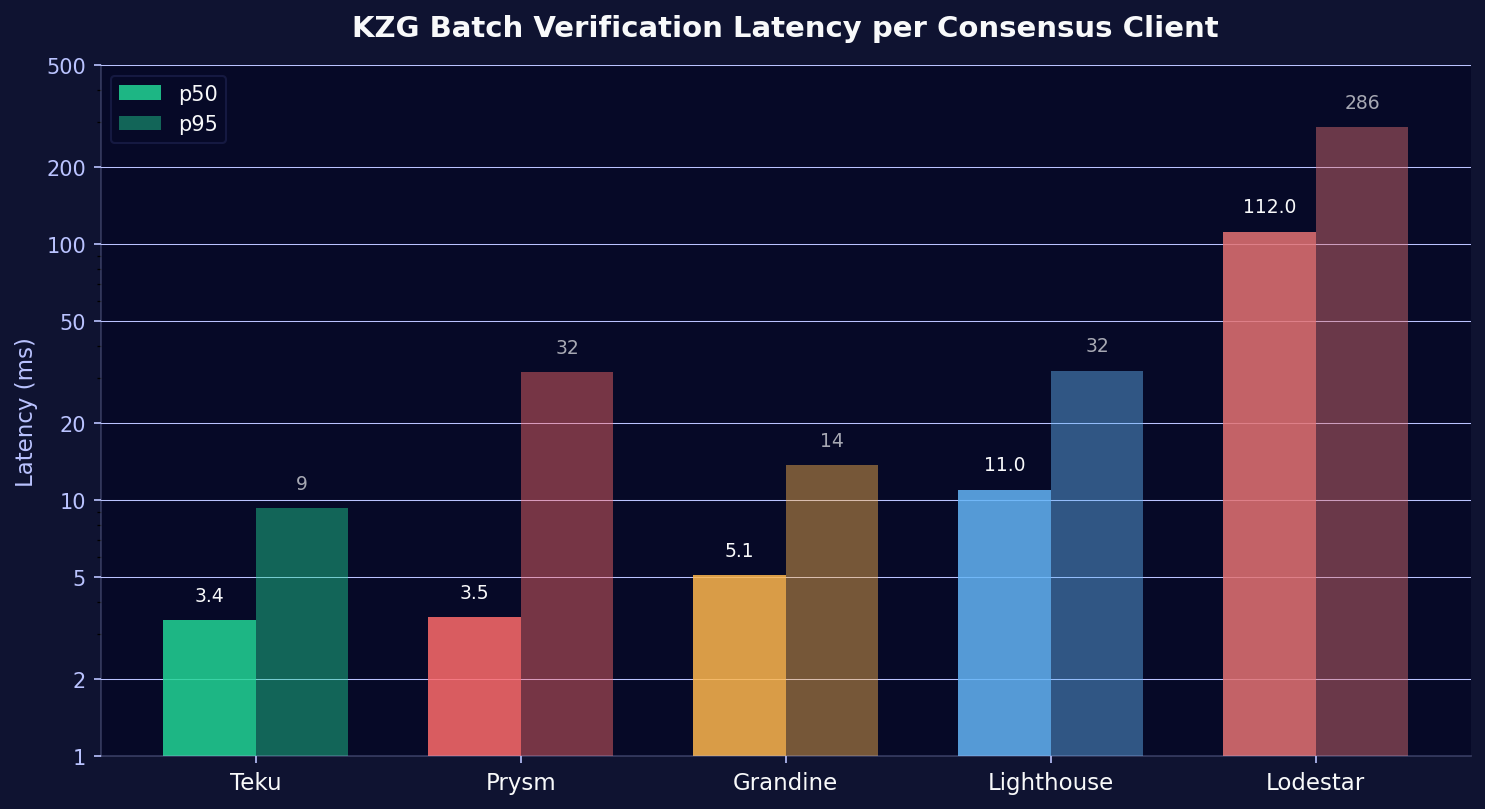
Finding 3: KZG batch verification confirms the pattern
KZG (Kate-Zaverucha-Goldberg) commitments are the mathematical proofs that guarantee data availability without requiring every node to download every blob. CCs batch-verify multiple KZG proofs at once for efficiency.
| CC | p50 | p95 |
|---|---|---|
| Teku | 3.4 ms | 9.3 ms |
| Prysm | 3.5 ms | 31.6 ms |
| Grandine | 5.1 ms | 13.7 ms |
| Lighthouse | 11.0 ms | 32.0 ms |
| Lodestar | 112 ms | 286 ms |
Same pattern: Teku leads, Lodestar trails by an order of magnitude. We looked at Teku's performance evolution across three versions in a separate post. Worth noting here: Grandine performs better here than in gossip verification, which indicates its KZG implementation (likely Rust-native) holds up well even under the supernode load of 128 custody groups.
Finding 4: Prysm struggles with data column collection
Prysm's verification speed is competitive (4.2ms p50). Its problem sits elsewhere: it fails to process the majority of incoming data column sidecars.
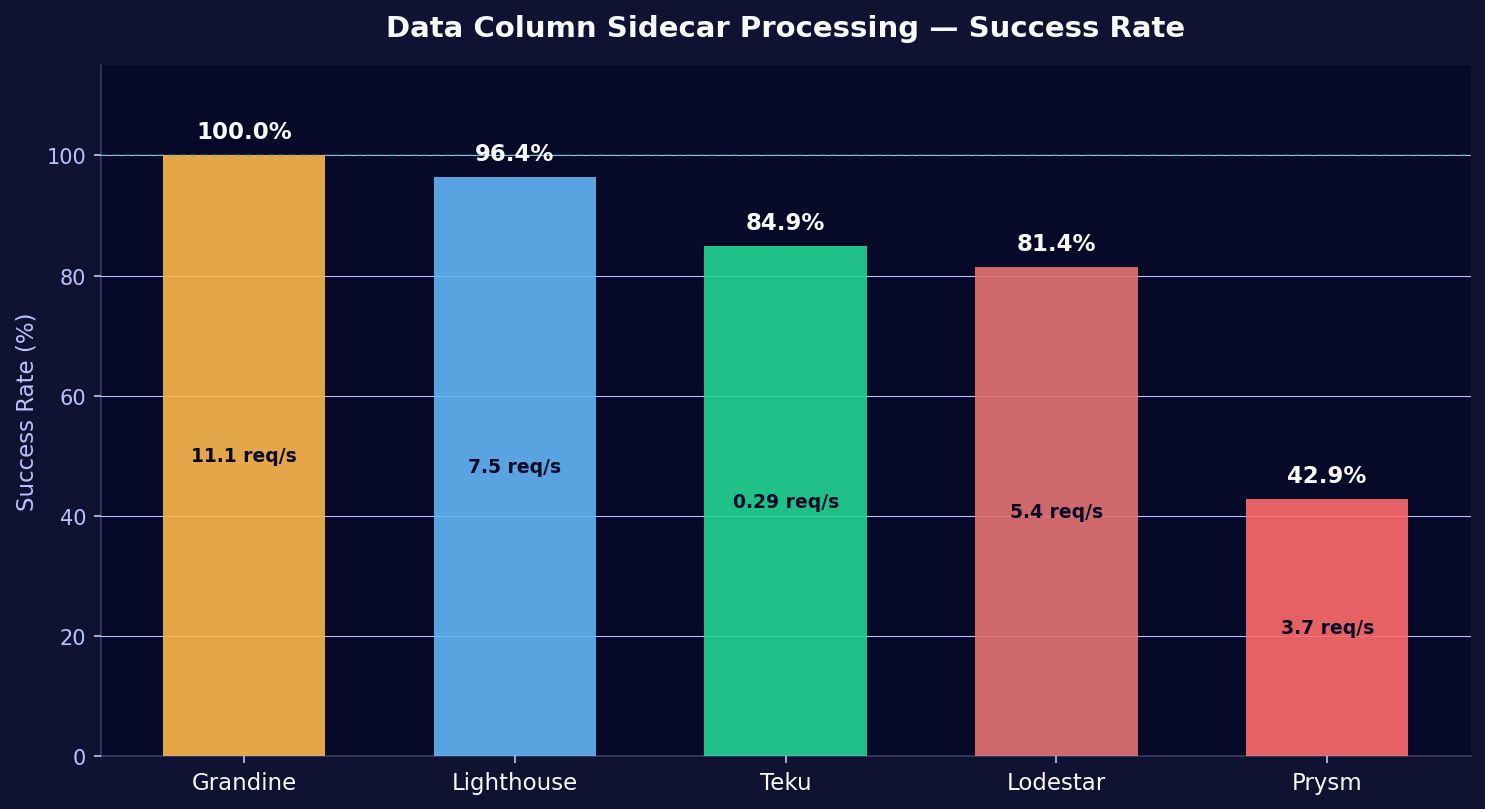
| CC | Requests/s | Successes/s | Success Rate |
|---|---|---|---|
| Grandine | 11.1 | 11.1 | 100% |
| Lighthouse | 7.5 | 7.2 | 96.4% |
| Teku | 0.29 | 0.25 | 84.9% |
| Lodestar | 5.4 | 4.4 | 81.4% |
| Prysm | 3.7 | 1.6 | 42.9% |
Prysm processes only 43% of data column sidecar requests successfully. More than half fail, forcing the client into a costly fallback: data column reconstruction.
Teku's low absolute rate (0.29 req/s) reflects its standard 4-custody-group configuration. It receives fewer data columns. Its 85% success rate may be partially inflated by sampling effects at low volume.
Finding 5: Reconstruction is expensive, and Prysm needs it constantly
When a node does not collect all required data columns via gossip, it can attempt to reconstruct missing columns from the ones it has, provided it has at least 50% of the 128 columns. Reconstruction uses erasure coding and is computationally expensive.
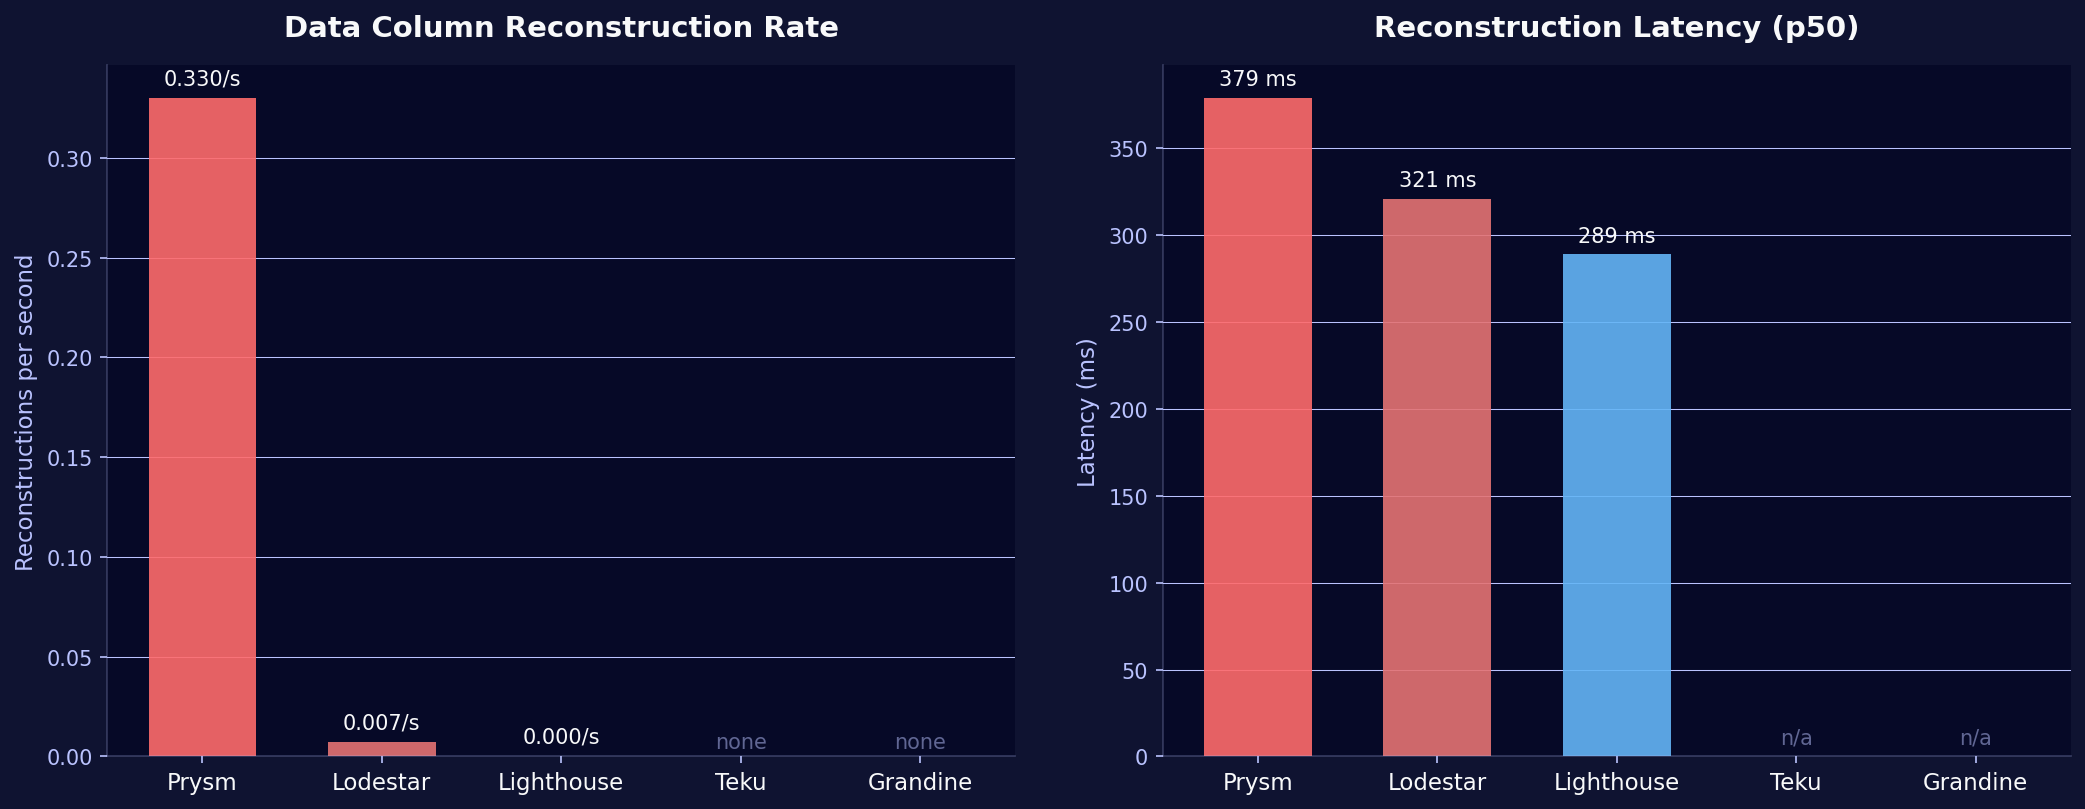
| CC | Reconstructions/s | p50 Latency | p95 Latency |
|---|---|---|---|
| Prysm | 0.33/s | 379 ms | 689 ms |
| Lodestar | 0.007/s | 321 ms | 610 ms |
| Lighthouse | ~0/s | 289 ms | 834 ms |
| Teku | 0 | n/a | n/a |
| Grandine | 0 | n/a | n/a |
Prysm triggers reconstruction roughly once every 3 seconds, orders of magnitude more than any other client. With a 379ms median reconstruction latency, this adds real computational overhead.
Teku and Grandine never need reconstruction. They collect their custody columns via gossip every time, consistent with their high processing success rates.
For Prysm operators: The 43% success rate and constant reconstruction point to an issue in the gossip subscription or processing pipeline for data column sidecars. If reconstruction starts failing too, the node will miss data availability deadlines. Worth monitoring across future versions.
Finding 6: Execution client choice affects blob serving speed
Since Fusaka, consensus clients can fetch blobs directly from their local execution client via the engine_getBlobsV2 API. This is faster than waiting for gossip and helps the CC complete data availability checks sooner after a new block arrives.
We measured the getBlobsV2 response latency from Teku's perspective (the only CC that exposes per-EC latency histograms for this call):
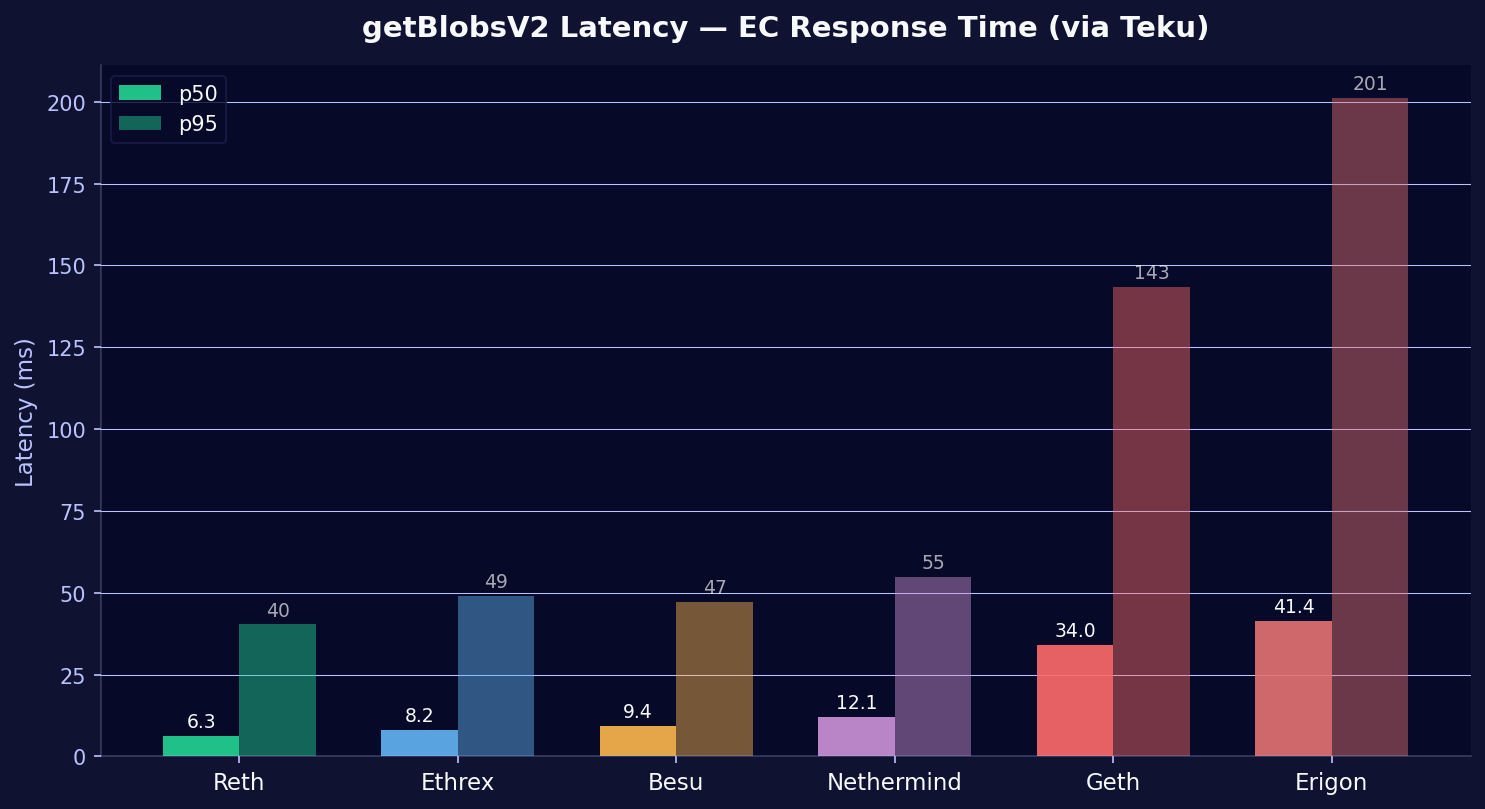
| EC | p50 | p95 |
|---|---|---|
| Reth | 6.3 ms | 40 ms |
| Ethrex | 8.2 ms | 49 ms |
| Besu | 9.4 ms | 47 ms |
| Nethermind | 12.1 ms | 55 ms |
| Geth | 34.0 ms | 143 ms |
| Erigon | 41.4 ms | 201 ms |
Reth serves blobs 6.5x faster than Erigon at p50. Reth and Ethrex are both Rust-based, newer execution clients with storage designs built after blobs existed. Geth and Erigon have blob pool implementations that predate the PeerDAS access pattern, which likely explains the gap. EC implementation differences also show up in sync speed, where we measured a range from 1.5 hours to 8+ days on the same hardware.
For operators optimizing attestation timing: The EC's blob serving speed determines how quickly your CC can complete data availability checks after a new block arrives. With Reth or Ethrex, that takes ~6-8ms. With Erigon, it can take 200ms+ at the tail.
Finding 7: Nimbus barely uses getBlobsV2
Total getBlobsV2 request counts from the Geth EC perspective (Geth is paired with every CC, so this gives a consistent comparison):
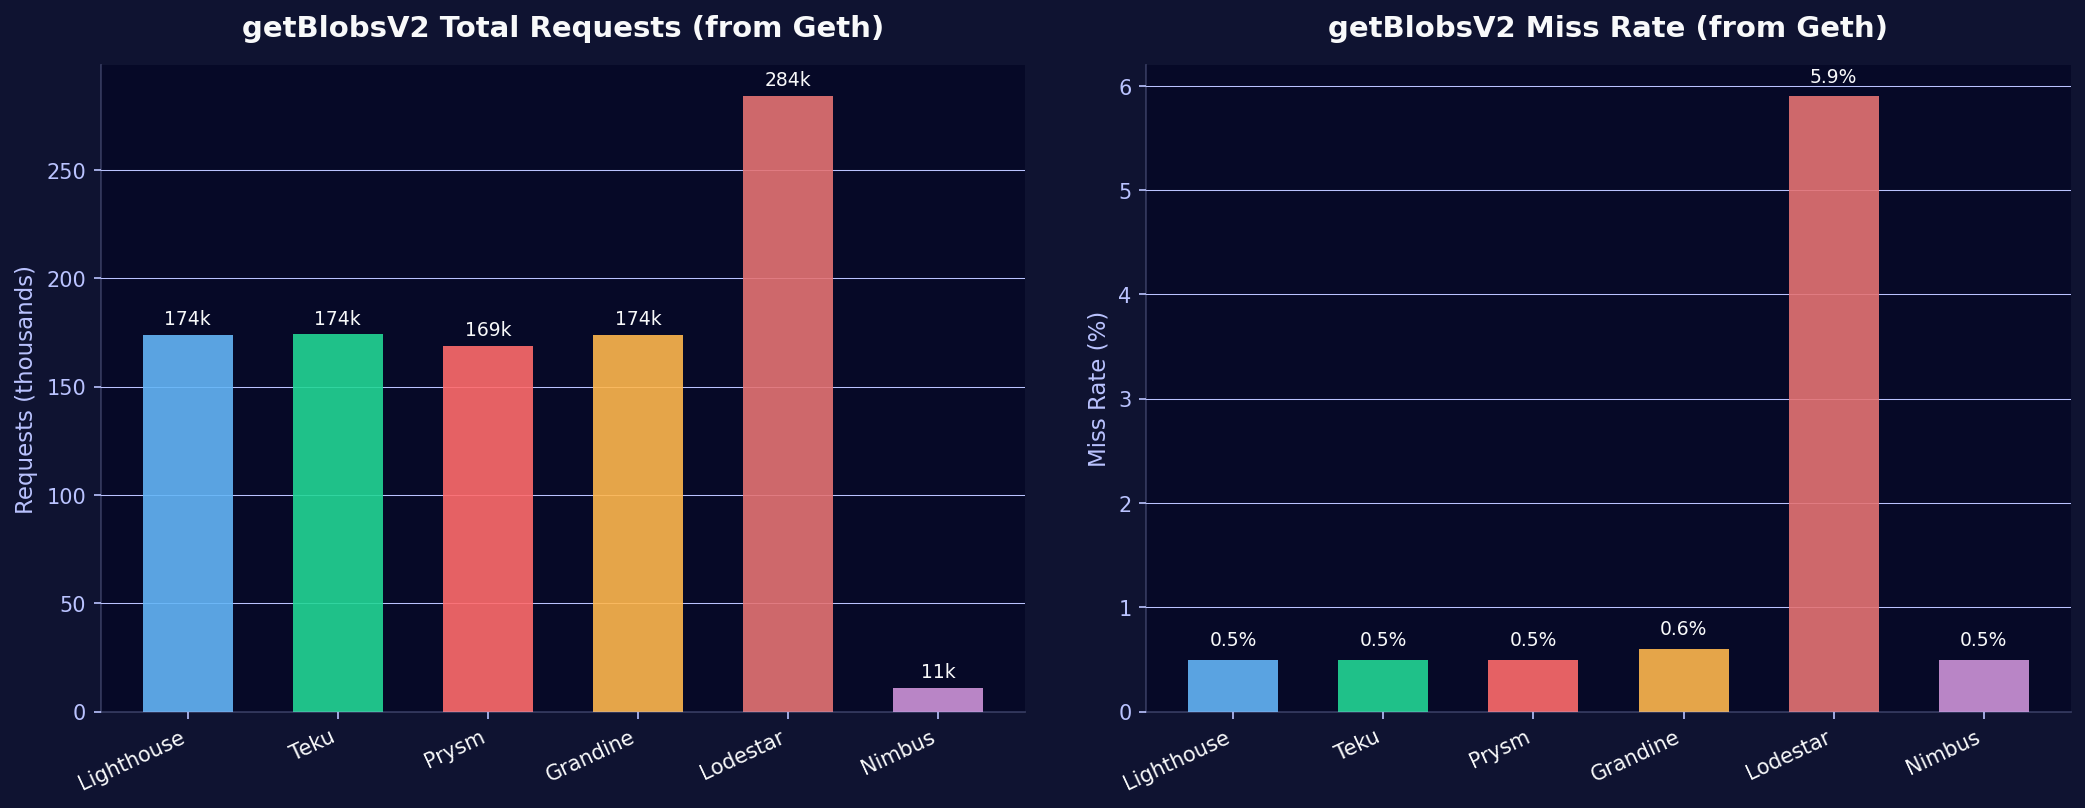
| CC | Requested Blobs | Misses | Miss Rate |
|---|---|---|---|
| Lighthouse | 174,057 | 787 | 0.5% |
| Teku | 174,138 | 843 | 0.5% |
| Prysm | 168,721 | 844 | 0.5% |
| Grandine | 173,870 | 1,085 | 0.6% |
| Lodestar | 284,042 | 16,632 | 5.9% |
| Nimbus | 10,838 | 55 | 0.5% |
Two outliers:
Nimbus makes 16x fewer getBlobsV2 requests than other clients. It relies primarily on P2P gossip to obtain blob data and uses the getBlobsV2 API as a fallback only. Whether this is intentional (gossip-first strategy) or because the feature is still in early adoption is not clear from the metrics alone. We observed similar architectural differences when investigating Nimbus block building behavior.
Lodestar makes 63% more requests than the average and has a 5.9% miss rate, 10x higher than other clients. With 128 custody groups (supernode behavior), Lodestar aggressively tries to fetch blobs from the EL. The high miss rate suggests blobs have already expired from the EC's blob pool by the time Lodestar requests them, pointing to a timing issue in Lodestar's fetch pipeline.
Data column gossip arrival timing
For context, we also measured when data column sidecars arrive relative to slot start. This is a pure network metric, independent of client implementation:
| Metric source | p50 | p95 |
|---|---|---|
| Lighthouse (all EC pairings) | ~1.57s after slot start | ~3.2s |
| Nimbus (all EC pairings) | ~1.39s after slot start | ~3.6s |
Data columns typically arrive 1.4 to 1.6 seconds after the slot begins, with 95% arriving within 3.2 to 3.6 seconds. This is consistent across all EC pairings. Gossip arrival is purely a P2P network phenomenon, not influenced by the local EC.
CCs therefore have roughly 0.4 to 2.6 seconds between data column arrival and the attestation deadline (4 seconds into the slot) to complete verification. At Teku's 3.9ms verification speed, that is plenty. At Lodestar's 469ms p95, it gets tight.
Summary table
| Metric | Grandine | Lighthouse | Teku | Nimbus | Prysm | Lodestar |
|---|---|---|---|---|---|---|
| Custody groups | 128 | ~105† | 4 🔴 | ? | ? | 128 |
| Gossip verify p50 | 4.0 ms | 10.6 ms | 3.9 ms 🟢 | 3.2 ms 🟢 | 4.2 ms | 35.7 ms 🔴 |
| Gossip verify p95 | 19 ms | 24 ms | 10 ms 🟢 | 9 ms 🟢 | 23 ms | 469 ms 🔴 |
| KZG batch p50 | 5.1 ms | 11.0 ms | 3.4 ms 🟢 | n/a | 3.5 ms 🟢 | 112 ms 🔴 |
| Processing success | 100% 🟢 | 96.4% | 84.9% | n/a | 42.9% 🔴 | 81.4% |
| Reconstruction/s | 0 🟢 | ~0 | 0 🟢 | n/a | 0.33 🔴 | 0.007 |
| getBlobsV2 usage | 174k | 174k | 174k | 11k 🟠 | 169k | 284k 🟠 |
| getBlobsV2 miss% | 0.6% | 0.5% | 0.5% | 0.5% | 0.5% | 5.9% 🔴 |
🟢 = best in class · 🟠 = notable outlier · 🔴 = potential concern · †indirect via peers_per_custody_group_count
Takeaways
The 50x spread in gossip verification latency between Teku (3.9ms p50) and Lodestar (469ms p95) is the headline number from this analysis. It feeds directly into data availability timing models: how long does a CC need between receiving a data column and publishing its attestation? At 3.9ms the answer is "no measurable impact". At 469ms, each verification burns a chunk of the ~2.6 seconds between typical gossip arrival and the attestation deadline. PeerDAS security models that assume uniform verification times across clients need to account for this spread, especially since Lodestar is the only TypeScript-based CC and carries a runtime disadvantage for the cryptographic operations involved (KZG proofs, hashing).
The custody group situation turned out more nuanced than expected. All nodes on our fleet have validator clients attached and should therefore custody all 128 groups. Lodestar, Grandine, and Lighthouse do this correctly. Teku 26.4.0 reports only 4 custody groups despite having validators assigned, which raises a question about its auto-upgrade behavior or whether a specific CLI flag is needed. Nimbus and Prysm do not expose custody metrics at all, making it impossible to verify from Prometheus alone. For operators, this is worth checking manually. For anyone modeling PeerDAS network-level data availability, the default custody behavior is not consistent across implementations.
Prysm's 43% processing success rate with constant reconstruction (0.33/s at 379ms p50 latency) points to a problem upstream of verification. The KZG verification itself is fast (3.5ms p50), so the bottleneck is in the gossip collection or processing pipeline. If reconstruction were to fail on top of that, the node would miss data availability deadlines.
On the EC side, the choice of execution client has a measurable effect on blob serving latency via getBlobsV2. Reth and Ethrex respond in 6 to 8ms at p50. Geth and Erigon take 34 to 41ms, with Erigon reaching 201ms at p95. Over thousands of attestations, this compounds. It is a new performance dimension that did not exist before Fusaka and is worth considering when choosing an EC pairing, particularly for validators where attestation timing matters.
Nimbus's minimal use of getBlobsV2 (16x fewer requests than other clients) remains an open question. It may be a deliberate gossip-first architecture, or it may reflect early-stage getBlobsV2 adoption. The operational impact depends on whether gossip alone is sufficient to meet data availability deadlines reliably. Our earlier analysis of Nimbus block building behavior showed a similar pattern of Nimbus taking its own path on feature adoption.
Metric naming: Prysm uses millisecond-unit variants of several histogram metrics (e.g., beacon_data_column_sidecar_gossip_verification_milliseconds_bucket). Values were converted to seconds for comparison. Nimbus uses distinct metric names (data_column_sidecar_validation_duration, data_column_sidecars_received_total) that are not 1:1 comparable but represent the same operations. All data was queried from our prometheus-cold datasource. For details on our metric collection, see the StereumLabs client metrics documentation.