Fusaka hardfork: hardware impact on non-supernodes


We measured CPU, memory, disk I/O, and network across all 36 CC×EC pairings on our non-supernode fleet — here's what the Fusaka hardfork actually did to hardware consumption.
What is Fusaka?
Ethereum's Fusaka hardfork activated on December 3, 2025 at 21:49 UTC (slot 13,164,544). It was the second hard fork of 2025 after Pectra (May 2025) and arguably the most consequential upgrade since the Merge. The name combines "Fulu" (consensus layer, named after a star) and "Osaka" (execution layer, named after the host city of Devcon 2025).
The headline feature is PeerDAS (Peer Data Availability Sampling, EIP-7594) — a fundamental change in how Ethereum verifies blob data. Instead of every node downloading and verifying every blob, nodes now only need to sample small slices, verifying that the full data exists without actually possessing all of it. Vitalik Buterin called it "literally sharding" — Ethereum reaching consensus on blocks without requiring any single node to see more than a tiny fraction of the data.
Beyond PeerDAS, Fusaka shipped approximately 12 additional EIPs:
- EIP-7935 — raises the default block gas limit, targeting ~60 million gas
- EIP-7825 — introduces a per-transaction gas cap of 16.78 million to prevent single-transaction DoS attacks
- EIP-7892 — the Blob Parameter Only (BPO) mechanism, allowing blob capacity increases between hard forks
- EIP-7951 — secp256r1 precompile for device-native signing and passkeys
- EOF (EVM Object Format) — a cleaner, more efficient programming structure for smart contracts
- EIP-7918 — stabilizes blob fees
- EIP-7742 — new opcodes including CLZ (count leading zeros) for more efficient cryptographic operations
Two scheduled BPO forks followed:
- BPO-1 (~December 9–10): blob target/max raised from 6/9 to 10/15
- BPO-2 (~December 23 – January 7): blob target/max raised to 14/21
We wanted to know: what did all this actually do to the hardware running our nodes?
Methodology
Fleet setup
StereumLabs runs approximately 90 hosts split across GCP cloud instances and NDC2 bare-metal nodes in Vienna, Austria. Each non-supernode host runs one consensus client (CC) paired with one execution client (EC), covering all 36 possible combinations of:
- Consensus clients: Grandine, Lighthouse, Lodestar, Nimbus, Prysm, Teku
- Execution clients: Besu, Erigon, Ethrex, Geth, Nethermind, Reth
Data source
All metrics come from our prometheus-cold datasource (UID aez9ck4wz05q8e, Org 6), which covers all available metrics without retention or delay restrictions. Node-level system metrics are collected via prometheus-node-exporter at a 15-second scrape interval.
Comparison windows
We compared two 14-day windows:
| Period | Range | Label |
|---|---|---|
| Before Fusaka | November 19 – December 3, 2025 | Pre-fork baseline |
| After Fusaka | December 4 – December 18, 2025 | Post-fork + BPO-1 |
Both windows use avg_over_time(...[14d:1h]) — a 14-day average at 1-hour subquery resolution, computed as an instant query at the boundary timestamp. This smooths out transient spikes while preserving meaningful shifts.
Filtering
Supernodes are excluded via the label filter cc_client!~".*-super". Only instances with role=~"cc|ec" are included. Network metrics exclude loopback and virtual interfaces (device!~"lo|veth.*|docker.*|br.*").
Fleet-level results
Here's what happened across the entire non-supernode fleet:
| Metric | Before | After | Change |
|---|---|---|---|
| CPU utilization (avg) | 4.66% | 6.08% | +30% |
| Memory used (avg) | 6.06 GiB | 5.59 GiB | −8% |
| Network RX (avg) | 2.20 MiB/s | 0.87 MiB/s | −60% |
| Network TX (avg) | 0.20 MiB/s | 0.18 MiB/s | −13% |
| Disk read rate (avg) | 2.58 MiB/s | 1.21 MiB/s | −53% |
| Disk write rate (avg) | 1.73 MiB/s | 1.92 MiB/s | +11% |
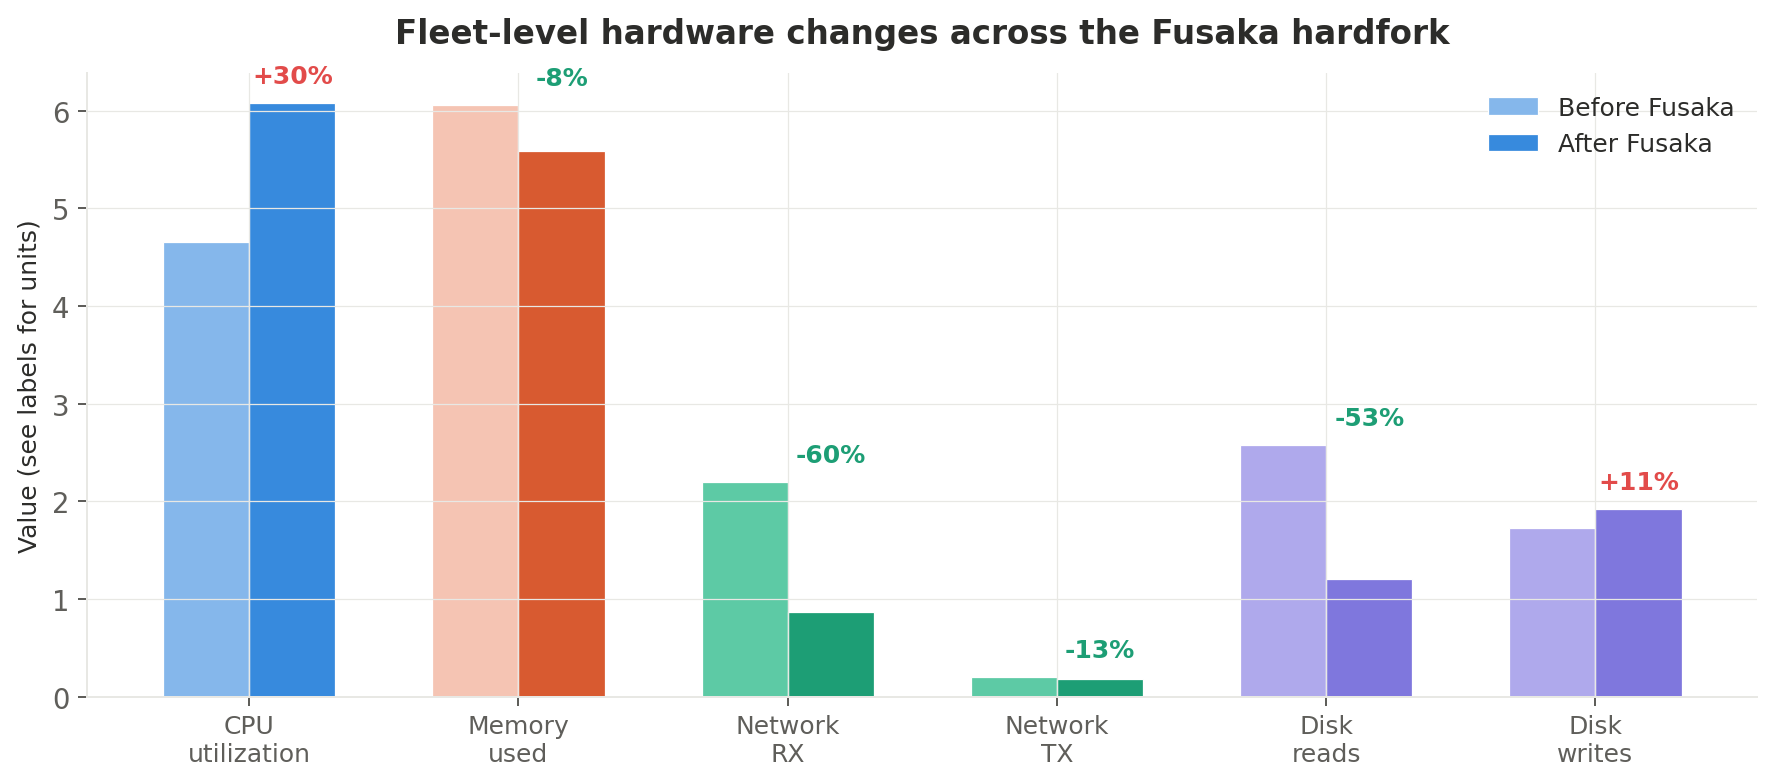
PeerDAS delivered exactly what it promised: dramatically less network bandwidth and lower memory at the cost of modestly higher CPU. Disk reads halved. Operators paying per-GB egress on cloud providers should see meaningful cost savings.
Let's dig into each metric.
Network bandwidth: the biggest win
The most striking result is the 60% drop in network receive bandwidth — from 2.20 MiB/s to 0.87 MiB/s on average. This is PeerDAS in action: nodes now verify only sampled slices of blob data rather than downloading entire blobs.
Daily trend
Looking at the daily time series, the decline actually began before the fork itself — around November 28–29 — suggesting some nodes started running fork-compatible client versions with PeerDAS-like optimizations ahead of the December 3 activation. On the fork day itself, the fleet-average RX was already down to 0.26 MiB/s.
The post-fork trend shows a brief recovery as nodes settled into the new protocol, stabilizing around 1.4 MiB/s by mid-December — still a 36% reduction from the pre-decline baseline of ~2.2 MiB/s.
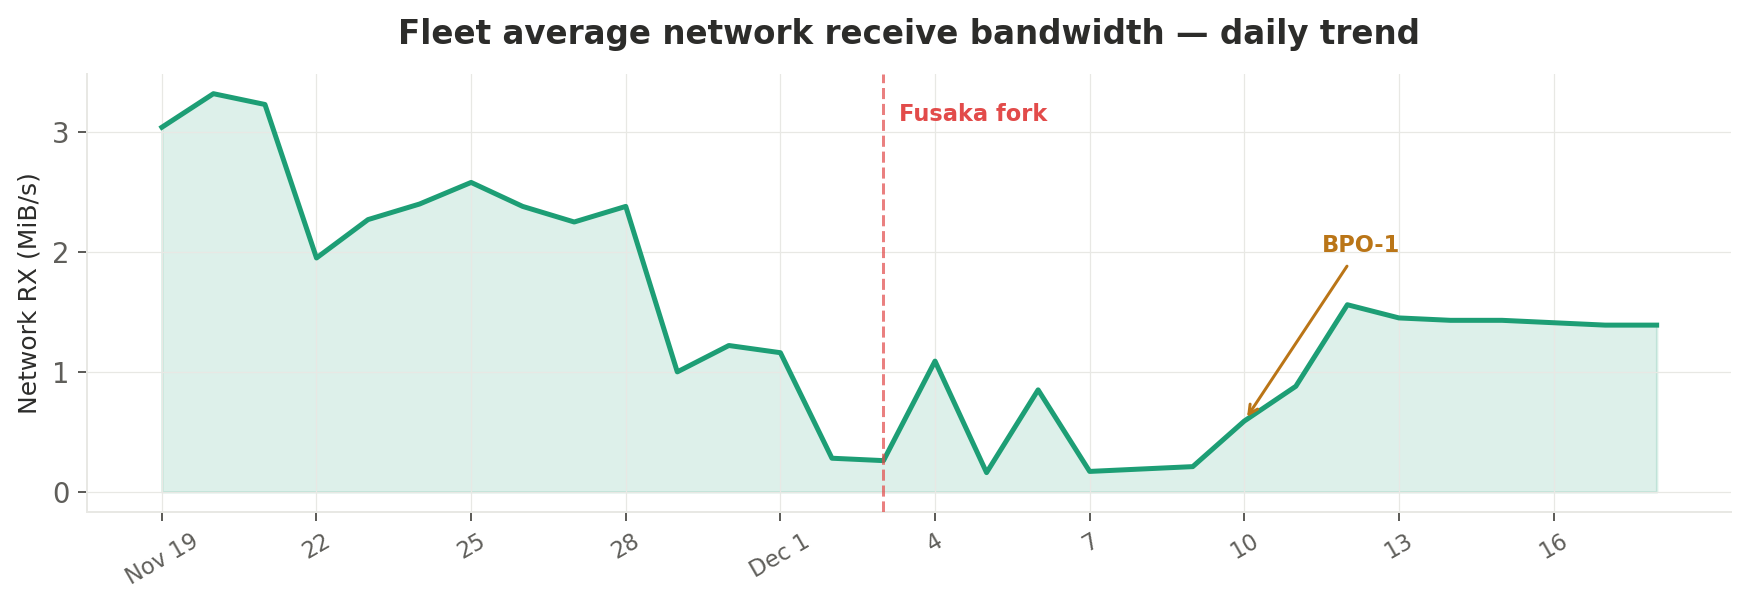
| Date | RX (MiB/s) | Event |
|---|---|---|
| Nov 19 | 3.04 | |
| Nov 28 | 2.38 | Pre-fork decline begins |
| Dec 3 | 0.26 | Fusaka fork |
| Dec 4 | 1.09 | Post-fork stabilization |
| Dec 10 | 0.59 | BPO-1 |
| Dec 18 | 1.39 | Settled baseline |
Network transmit bandwidth also decreased, though more modestly — from 0.20 to 0.18 MiB/s (−13%).
For GCP instances, network egress costs $0.085–$0.12/GB depending on region and volume. A node running at 2.2 MiB/s averages ~5.7 TB/month of inbound traffic. At the new 0.87 MiB/s rate, that drops to ~2.2 TB/month — a potential saving of $300–$400/month per node on egress alone, depending on provider and plan.
CPU utilization: moderate increase, one clear outlier
Fleet-average CPU rose from 4.66% to 6.08% — a 30% relative increase, but in absolute terms still very modest. This is the expected trade-off: PeerDAS introduces data availability sampling routines (compute) in exchange for reduced data transfer (bandwidth).
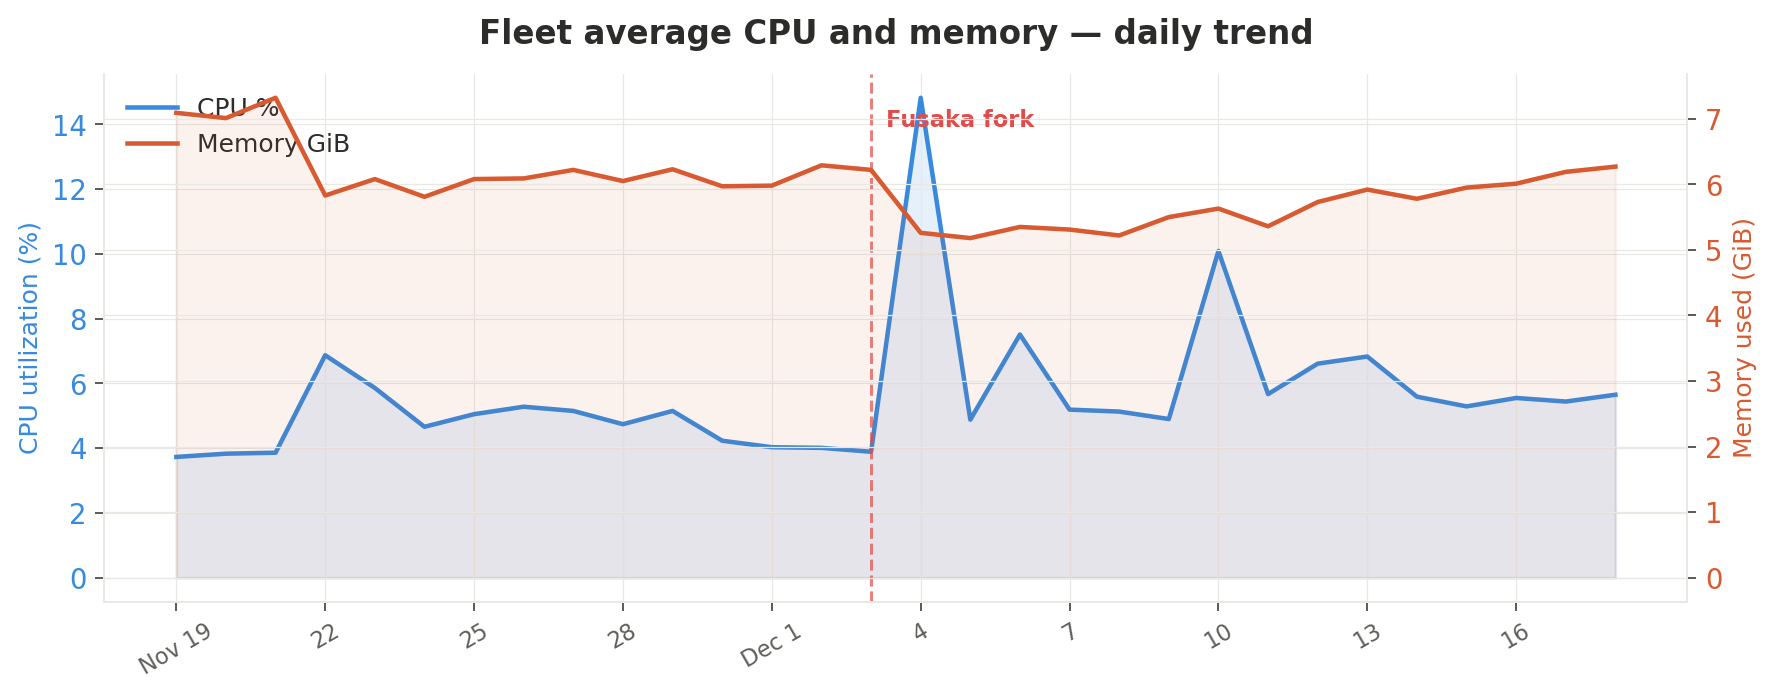
The fork-day spike
The daily time series reveals two notable spikes:
- December 4: 14.82% — the day after fork activation. All clients simultaneously processed new consensus rules, PeerDAS bootstrapping, and EOF-related state transitions. This spike was transient and resolved within 24 hours.
- December 10: 10.09% — coincides with BPO-1 raising the blob target/max from 6/9 to 10/15. The higher blob capacity required additional sampling work.
After settling, the new baseline sits around 5.5–5.7% — roughly 1 percentage point above pre-fork levels.
Per-consensus-client breakdown
Not all consensus clients handled Fusaka equally:
| CC client | Before | After | Change |
|---|---|---|---|
| Grandine | 5.84% | 7.06% | +21% |
| Lighthouse | 3.81% | 3.30% | −13% |
| Lodestar | 5.80% | 5.85% | +1% |
| Nimbus | 2.63% | 9.40% | +257% |
| Prysm | 4.38% | 4.86% | +11% |
| Teku | 5.66% | 5.96% | +5% |
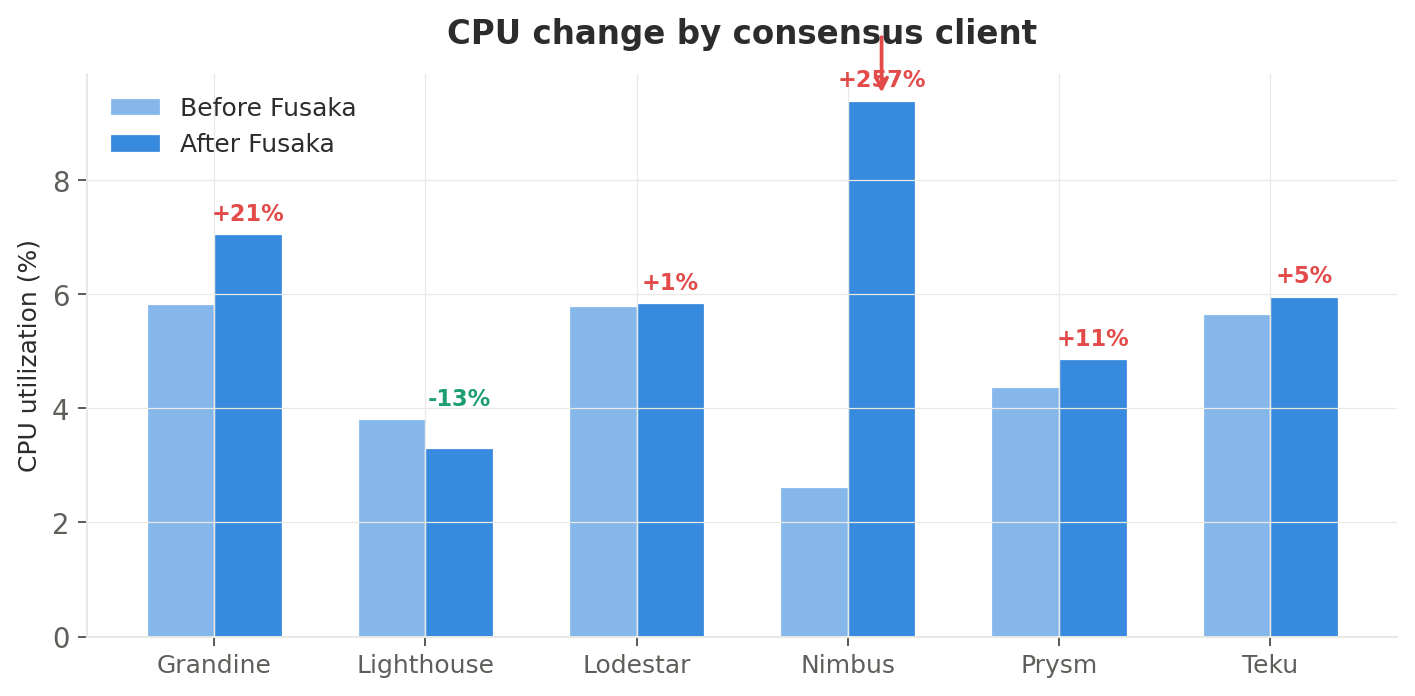
Nimbus stands out dramatically with a +257% CPU increase (2.63% → 9.40%). This suggests its PeerDAS implementation is currently more compute-intensive than competitors. The nimbus + reth pairing hit 16.78% post-fork — the highest of any combination in the fleet. Nimbus operators should monitor their CPU headroom closely, especially on resource-constrained setups.
On the positive side, Lighthouse was the only consensus client to decrease CPU usage (−13%), suggesting either an efficient PeerDAS implementation or concurrent optimizations shipped in its fork-compatible release.
Lodestar remained essentially flat (+1%), and Prysm (+11%), Teku (+5%), and Grandine (+21%) showed moderate increases — all within comfortable bounds for typical node hardware.
Per-execution-client breakdown
Execution clients saw a more uniform increase, consistent with the raised gas limit (EIP-7935) and new EVM opcodes (EOF):
| EC client | Before | After | Change |
|---|---|---|---|
| Besu | 2.58% | 5.19% | +101% |
| Erigon | 3.62% | 5.83% | +61% |
| Ethrex | 4.07% | 6.04% | +48% |
| Geth | 3.99% | 6.53% | +64% |
| Nethermind | 6.83% | 5.08% | −26% |
| Reth | 5.56% | 7.89% | +42% |
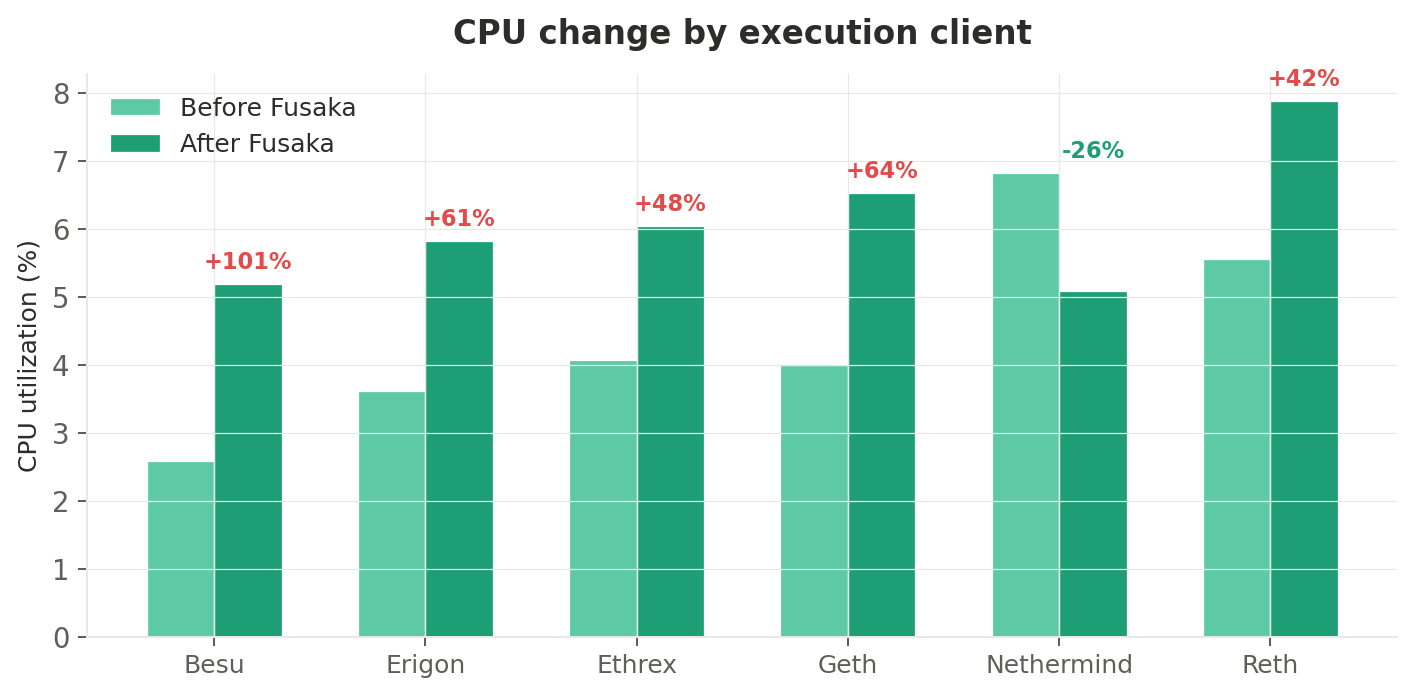
Besu (+101%) and Geth (+64%) saw the largest relative increases. For Besu, the doubling (from a very low 2.58% baseline) likely reflects the new gas limit activating code paths that were previously idle. Geth's increase is consistent with heavier block processing under the raised 60M gas ceiling.
Nethermind bucked the trend entirely with a −26% decrease — a surprising result that may indicate a coincidental version update with CPU optimizations during the measurement window.
The full picture: CPU heatmap across all 36 pairings
This heatmap shows the percentage change in CPU utilization for every CC×EC combination. Red means higher CPU after Fusaka, green means lower:
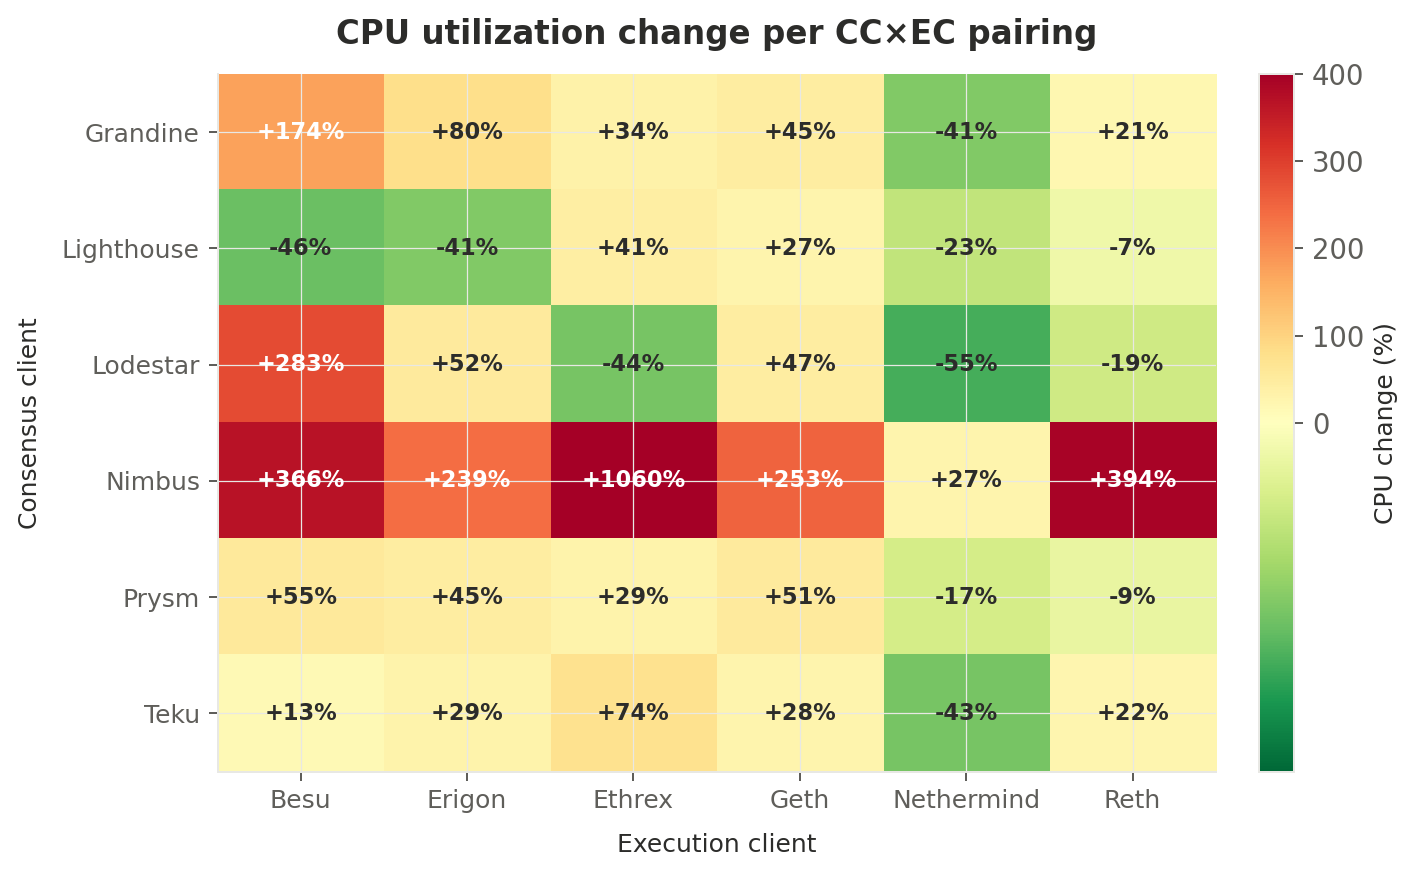
The Nimbus row is unmistakable — deep red across all EC pairings, with nimbus + ethrex showing an extreme +1060% (from 0.83% to 9.63%, though the low baseline suggests the pairing may have been partially offline pre-fork). The Nethermind column is notably green across most CC pairings, reinforcing that Nethermind itself saw a concurrent optimization.
Memory: a modest but welcome decrease
Average memory usage dropped from 6.06 GiB to 5.59 GiB (−8%) across the fleet. This aligns perfectly with PeerDAS's design: nodes no longer hold entire blobs in memory, only the sampled slices they need for verification.
Daily trend
The CPU + memory daily trend chart above also shows the memory trajectory (orange line). There's a sharp drop on December 4 (from 6.22 to 5.26 GiB) — the first full day after the fork — followed by a gradual recovery over the next two weeks as caches and new protocol state accumulated. By December 18, memory was back to 6.27 GiB, suggesting the initial drop was partly transient (e.g., cleared blob caches from the pre-fork protocol).
The 14-day average still shows a net decrease because the early post-fork days pull the average down significantly.
Per-consensus-client breakdown
| CC client | Before (GiB) | After (GiB) | Change |
|---|---|---|---|
| Grandine | 5.79 | 4.80 | −17% |
| Lighthouse | 5.41 | 5.42 | 0% |
| Lodestar | 7.97 | 6.82 | −14% |
| Nimbus | 4.89 | 3.91 | −20% |
| Prysm | 6.14 | 6.51 | +6% |
| Teku | 6.39 | 6.24 | −2% |
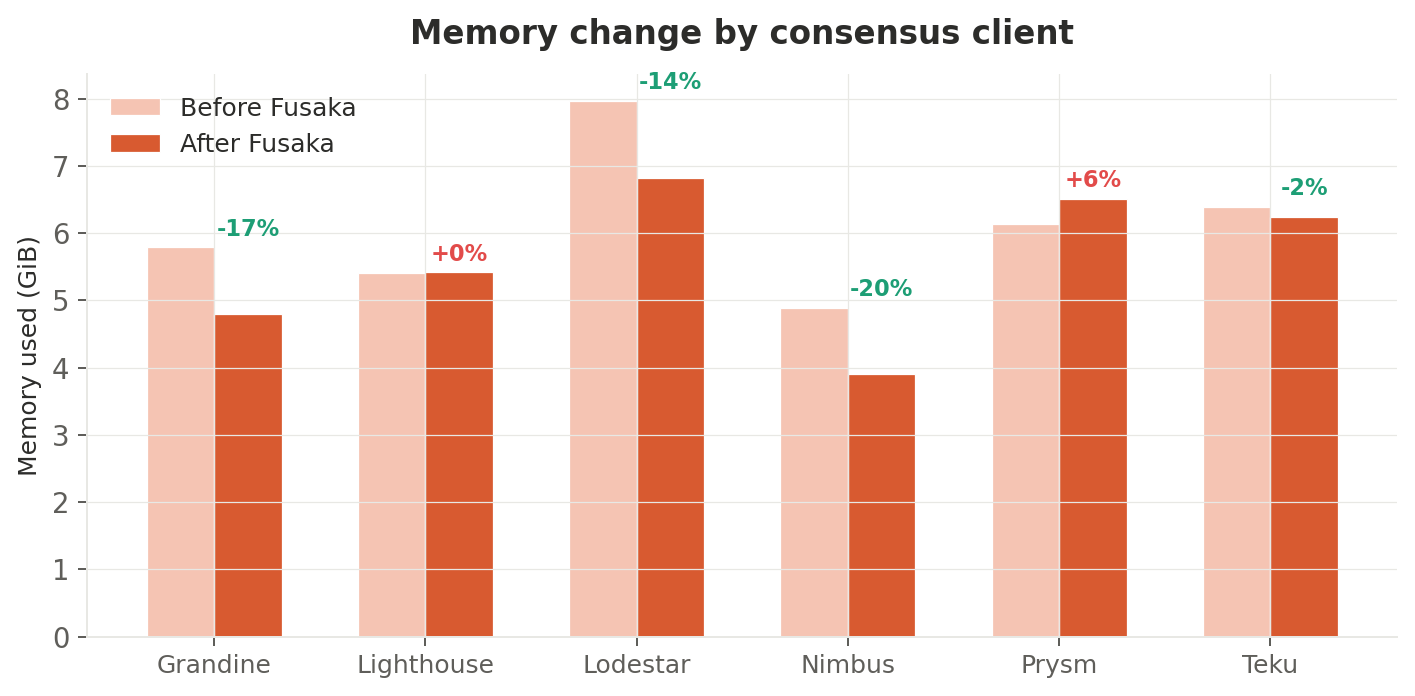
Nimbus (−20%) and Grandine (−17%) saw the largest memory reductions. Interestingly, Nimbus traded memory savings for CPU — a classic compute-vs-memory trade-off in its PeerDAS implementation.
Prysm was the only consensus client to increase memory (+6%), suggesting it keeps more sampling state in memory than peers. Given Prysm's CPU increase was moderate (+11%), this is a reasonable engineering choice.
Per-execution-client breakdown
| EC client | Before (GiB) | After (GiB) | Change |
|---|---|---|---|
| Besu | 6.59 | 4.31 | −35% |
| Erigon | 5.82 | 5.96 | +2% |
| Ethrex | 6.50 | 6.13 | −6% |
| Geth | 7.09 | 6.51 | −8% |
| Nethermind | 6.15 | 5.37 | −13% |
| Reth | 4.70 | 5.33 | +13% |
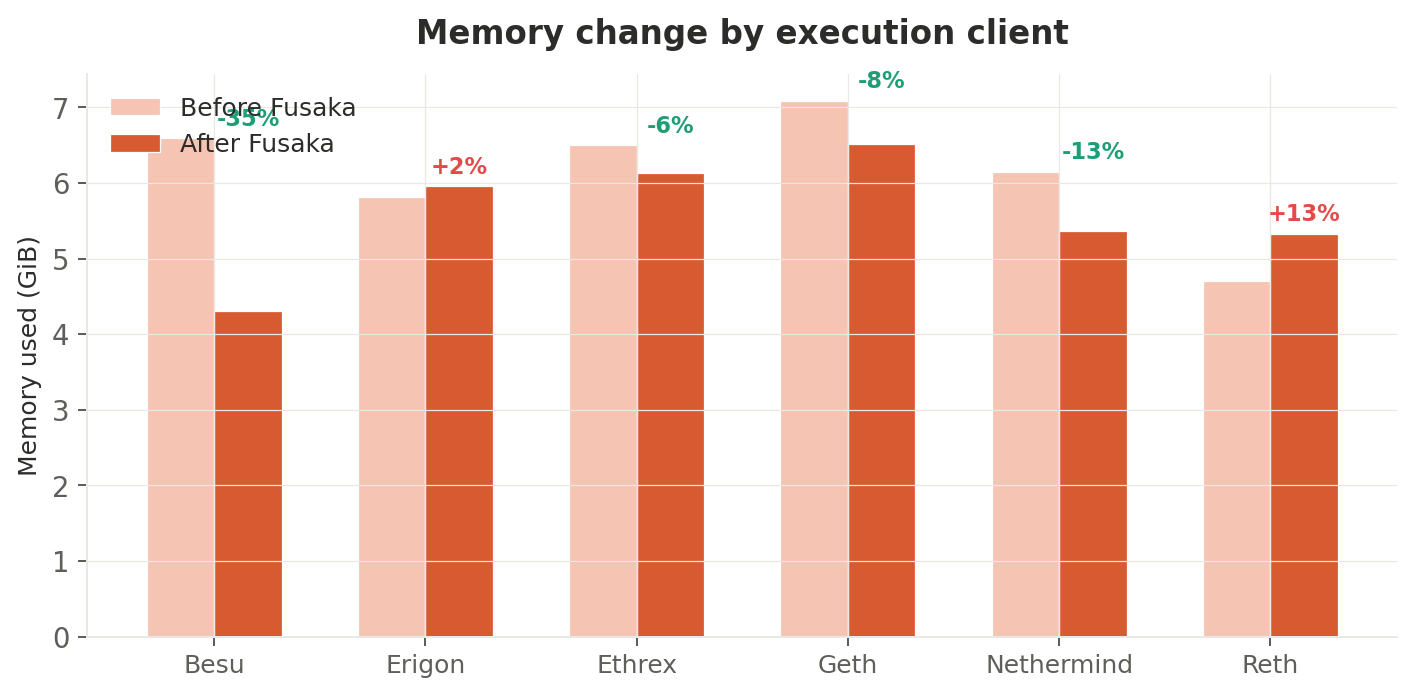
Besu saw a dramatic −35% memory drop — from 6.59 to 4.31 GiB. This is the largest single-client change in the dataset and likely reflects aggressive cache invalidation during the fork transition. Reth moved in the opposite direction (+13%), possibly due to its database engine accumulating more state under the new protocol.
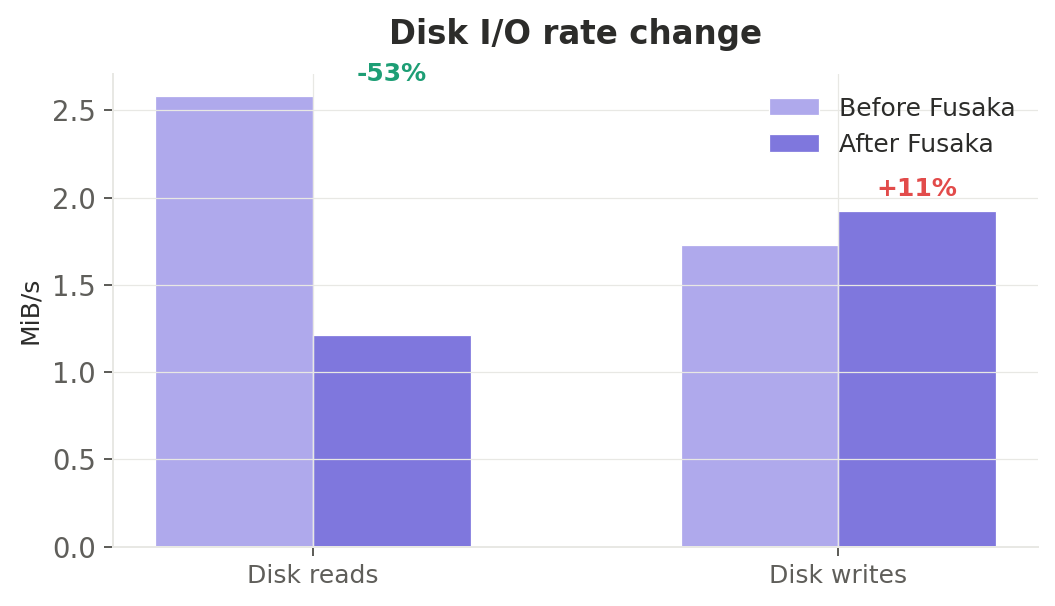
Disk I/O: reads halved, writes slightly up
Read rate
Disk reads dropped 53% — from 2.58 to 1.21 MiB/s. This is directly attributable to PeerDAS: nodes no longer need to retrieve full blobs from disk for verification. The reduction was visible across nearly all pairings.
Some notable per-pairing changes:
- teku + ethrex went from 26.18 MiB/s (an extreme outlier pre-fork) to 2.86 MiB/s — a 89% drop
- lighthouse + reth dropped from 1.71 to 0.55 MiB/s (−68%)
- grandine + reth moved in the opposite direction — from 0.08 to 3.23 MiB/s — suggesting a change in Grandine's blob retrieval strategy for PeerDAS
Write rate
Disk writes increased 11% — from 1.73 to 1.92 MiB/s. The increase is modest and likely comes from:
- PeerDAS sampling metadata — nodes now store sampling proofs and column indices
- EOF state changes — the EVM Object Format introduces new bytecode validation and storage patterns
- Higher gas limit — more transactions per block means more state writes
This is a small overhead relative to the substantial read savings.
Full 36-pairing matrices
For the detail-oriented, here are the complete CPU and memory matrices across all CC×EC combinations.
CPU utilization — before Fusaka (%)
| CC \ EC | Besu | Erigon | Ethrex | Geth | Nethermind | Reth |
|---|---|---|---|---|---|---|
| Grandine | 2.02 | 4.04 | 4.92 | 5.32 | 11.25 | 7.48 |
| Lighthouse | 2.39 | 3.20 | 2.74 | 3.65 | 5.20 | 4.43 |
| Lodestar | 2.32 | 3.75 | 9.62 | 3.66 | 7.68 | 7.73 |
| Nimbus | 1.41 | 2.42 | 0.83 | 2.40 | 5.32 | 3.40 |
| Prysm | 2.58 | 3.56 | 3.42 | 3.35 | 4.95 | 7.02 |
| Teku | 4.74 | 4.63 | 4.23 | 5.55 | 8.81 | 4.11 |
CPU utilization — after Fusaka (%)
| CC \ EC | Besu | Erigon | Ethrex | Geth | Nethermind | Reth |
|---|---|---|---|---|---|---|
| Grandine | 5.54 | 7.28 | 6.58 | 7.71 | 6.62 | 9.05 |
| Lighthouse | 1.28 | 1.89 | 3.87 | 4.64 | 3.98 | 4.13 |
| Lodestar | 8.88 | 5.69 | 5.42 | 5.37 | 3.46 | 6.27 |
| Nimbus | 6.57 | 8.21 | 9.63 | 8.46 | 6.77 | 16.78 |
| Prysm | 4.00 | 5.17 | 4.42 | 5.05 | 4.11 | 6.40 |
| Teku | 5.37 | 5.97 | 7.36 | 7.08 | 4.98 | 5.03 |
Memory usage — before Fusaka (GiB)
| CC \ EC | Besu | Erigon | Ethrex | Geth | Nethermind | Reth |
|---|---|---|---|---|---|---|
| Grandine | 6.12 | 5.70 | 5.16 | 6.18 | 7.15 | 4.46 |
| Lighthouse | 6.15 | 5.01 | 6.52 | 6.73 | 4.92 | 4.40 |
| Lodestar | 7.27 | 6.64 | 11.33 | 7.76 | 7.35 | 7.46 |
| Nimbus | 5.66 | 5.21 | 2.94 | 6.42 | 5.94 | 3.17 |
| Prysm | 6.31 | 6.08 | 8.42 | 6.70 | 5.66 | 4.28 |
| Teku | 8.01 | 6.51 | 4.59 | 8.74 | 7.20 | 4.93 |
Memory usage — after Fusaka (GiB)
| CC \ EC | Besu | Erigon | Ethrex | Geth | Nethermind | Reth |
|---|---|---|---|---|---|---|
| Grandine | 3.68 | 5.59 | 5.48 | 5.07 | 4.43 | 4.96 |
| Lighthouse | 2.48 | 3.57 | 7.36 | 7.10 | 5.58 | 6.41 |
| Lodestar | 5.61 | 7.30 | 7.05 | 8.21 | 5.45 | 7.32 |
| Nimbus | 2.24 | 5.74 | 3.29 | 4.73 | 4.97 | 2.47 |
| Prysm | 6.35 | 6.95 | 7.05 | 7.33 | 5.22 | 6.18 |
| Teku | 4.74 | 5.96 | 6.26 | 8.67 | 7.69 | 4.14 |
Things to watch
Nimbus CPU trajectory
The +257% CPU increase on Nimbus deserves monitoring over subsequent weeks and versions. If this is a temporary bootstrapping cost (PeerDAS column sync, initial sampling table construction), it should decline. If it persists, Nimbus operators on lower-spec hardware may need to re-evaluate their headroom.
BPO-2 effects (not captured here)
BPO-2 was scheduled for late December 2025 to early January 2026, raising blob parameters from 10/15 to 14/21. Our post-fork window (Dec 4–18) captures BPO-1 but not BPO-2. A follow-up analysis with a wider window would reveal whether the second parameter increase added further CPU or bandwidth pressure.
Memory recovery trend
The sharp initial memory drop post-fork appears to be partly transient — memory was trending back upward by December 18. We'll continue monitoring whether this recovery plateaus below the pre-fork baseline or converges back to original levels.
The nimbus + ethrex anomaly
The nimbus + ethrex pairing showed anomalously low CPU pre-fork (0.83%), which may indicate the pairing was partially offline or in a degraded state during the pre-fork window. The post-fork value of 9.63% is more consistent with fleet norms, suggesting the pairing recovered during or after the fork transition.
Client version confounding
Client versions were not pinned across the fork boundary — some pairings may have undergone version upgrades alongside Fusaka. This means we cannot cleanly attribute all changes to the fork itself. In particular, Nethermind's −26% CPU decrease may reflect a version update rather than a Fusaka effect.
Bottom line
Fusaka delivered on its core promise for non-supernode operators: dramatically lower bandwidth requirements (−60% receive, −13% transmit) and modestly lower memory (−8%), at the cost of a moderate CPU increase (+30%) that remains well within typical hardware headroom. Disk reads dropped by half.
For operators managing hosting costs, the network savings alone are significant — especially on cloud providers where egress is metered. The CPU overhead is real but manageable: even the worst-case fleet average post-fork (6.08%) leaves substantial headroom on modern hardware.
The main action item is monitoring Nimbus deployments for elevated CPU, and tracking BPO-2 effects as blob capacity continues to expand.
Appendix: PromQL queries used
For reproducibility, here are the exact queries run against prometheus-cold:
avg by (cc_client, ec_client) (
  avg_over_time(
    (1 - rate(node_cpu_seconds_total{mode="idle", role=~"cc|ec", cc_client!~".*-super"}[1h]))
    [14d:1h]
  )
)
avg by (cc_client, ec_client) (
  avg_over_time(
    (node_memory_MemTotal_bytes{role=~"cc|ec", cc_client!~".*-super"}
     - node_memory_MemAvailable_bytes{role=~"cc|ec", cc_client!~".*-super"})
    [14d:1h]
  )
) / 1024 / 1024 / 1024
avg by (cc_client, ec_client) (
  avg_over_time(
    rate(node_disk_read_bytes_total{role=~"cc|ec", cc_client!~".*-super"}[1h])
    [14d:1h]
  )
) / 1024 / 1024
avg by (cc_client, ec_client) (
  avg_over_time(
    rate(node_network_receive_bytes_total{role=~"cc|ec", cc_client!~".*-super",
         device!~"lo|veth.*|docker.*|br.*"}[1h])
    [14d:1h]
  )
) / 1024 / 1024
Datasource: prometheus-cold (UID: aez9ck4wz05q8e, Org 6)
Before snapshot: instant query at 2025-12-03T00:00:00Z
After snapshot: instant query at 2025-12-18T00:00:00Z
Daily time series: range query from 2025-11-19T00:00:00Z to 2025-12-18T00:00:00Z, step = 86400s