Nimbus v26.3.1: Validator monitoring and block building across 5 execution clients


How does each execution client behave when Nimbus asks it to build a block? We monitored 1,000 validator pubkeys across 5 EC pairings for 48 hours and found that block building performance varies dramatically, with one client producing near-empty blocks while the other four packed in millions of gas.
Overview
We run 5 Nimbus multiarch-v26.3.1 beacon nodes on our NDC2 bare-metal fleet in Vienna, each paired with a different execution client:
| Consensus Client | Execution Client | Location |
|---|---|---|
| Nimbus v26.3.1 | Besu 26.2.0 | NDC2, Vienna |
| Nimbus v26.3.1 | Erigon v3.3.10 | NDC2, Vienna |
| Nimbus v26.3.1 | Ethrex 9.0.0 | NDC2, Vienna |
| Nimbus v26.3.1 | Geth v1.17.2 | NDC2, Vienna |
| Nimbus v26.3.1 | Nethermind 1.36.2 | NDC2, Vienna |
A sixth node (Nimbus + Reth v1.11.3) is also deployed, but Reth has not yet completed its initial sync and is therefore excluded from this analysis.
All 5 nodes use Nimbus' built-in validator_monitor feature to passively observe the same set of 1,000 validator pubkeys on-chain. The validator monitor tracks attestation inclusion, vote correctness, block proposals, and timing data for these validators without requiring the signing keys to be locally attached.
This is a shadow configuration: a reverse proxy mirrors the validator client's requests to these beacon nodes, but the beacon nodes' responses do not reach the validator client. This means the data reflects how each CC+EC pairing observes and reacts to validator duties, but is not fully representative of a production validator setup where the EC's block building output would actually be submitted to the network.
The full analysis covers a 48-hour window ending April 13, 2026. Data sources: Prometheus (prometheus-cold) for metrics and Elasticsearch (Filebeat) for both EC container logs and Nimbus CC container logs.
Block building: the headline finding
When one of the 1,000 monitored validators is selected as block proposer, Nimbus triggers engine_forkchoiceUpdatedV3 with payload attributes on its paired EC, asking it to build a block. The EC then constructs the execution payload iteratively, improving it over several seconds until Nimbus calls engine_getPayloadV4 to retrieve the result.
Over 48 hours, block building was triggered for approximately 13 unique blocks. The results differ dramatically between execution clients.
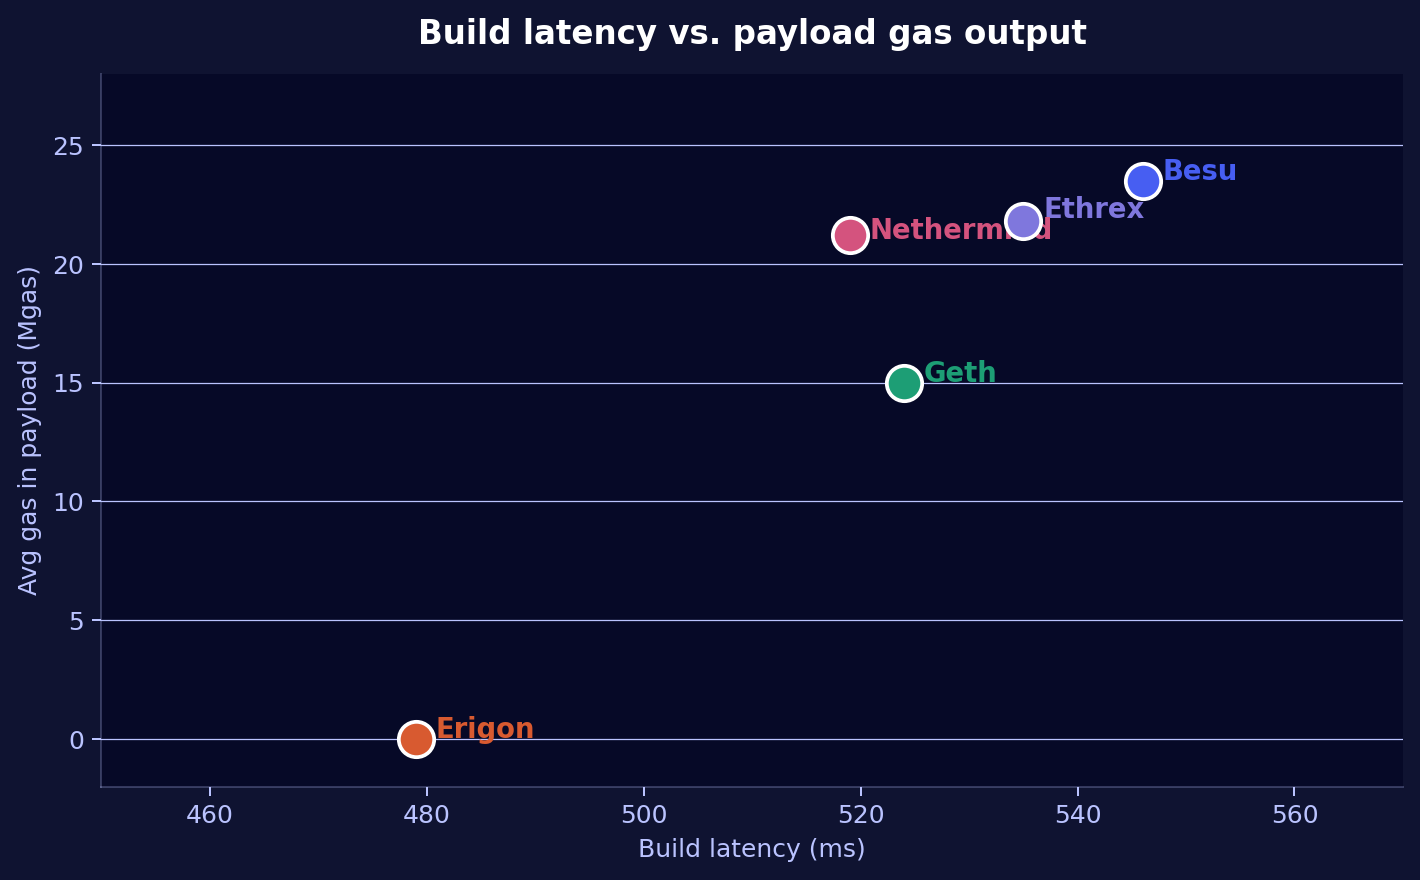
Build latency vs. payload output
Nimbus logs the exact timestamps for Requesting engine payload and Received engine payload, giving us the end-to-end build latency and resulting gas_used for every payload. This CC-side perspective is consistent across all ECs and fills in data even when the EC's own logs lack detail.
| EC | Avg latency | Min | Max | Avg gas (Mgas) | Blocks |
|---|---|---|---|---|---|
| Besu | 546ms | 75ms | 848ms | 23.5 | 11 |
| Ethrex | 535ms | 27ms | 728ms | 21.8 | 13 |
| Nethermind | 519ms | 28ms | 696ms | 21.2 | 13 |
| Geth | 524ms | 24ms | 756ms | 15.0 | 13 |
| Erigon | 479ms (fastest) | 18ms | 523ms | 0.0 | 12 |
The most counterintuitive finding: Erigon is the fastest responder (479ms avg) yet delivers 0 gas. Its transaction pool is apparently unable to supply transactions within the build window, so it returns an empty block quickly rather than spending time filling it. Besu takes 67ms longer on average but uses that time to pack 23.5 Mgas into the payload.
For high-gas blocks (slots with blob transactions), latency increases across all ECs: Besu peaks at 848ms for a 60M gas block, Ethrex at 728ms for the same block. This confirms that build latency scales with payload complexity.
One slot shows anomalously low latency for all ECs (Erigon 18ms, Geth 24ms, Ethrex 27ms, Nethermind 28ms, Besu 75ms). This is likely a cached or pre-built payload that Nimbus retrieved immediately.
Per-block distribution
The averages above compress a wide range of behavior into single numbers. Plotting every individual block build reveals the full distribution:
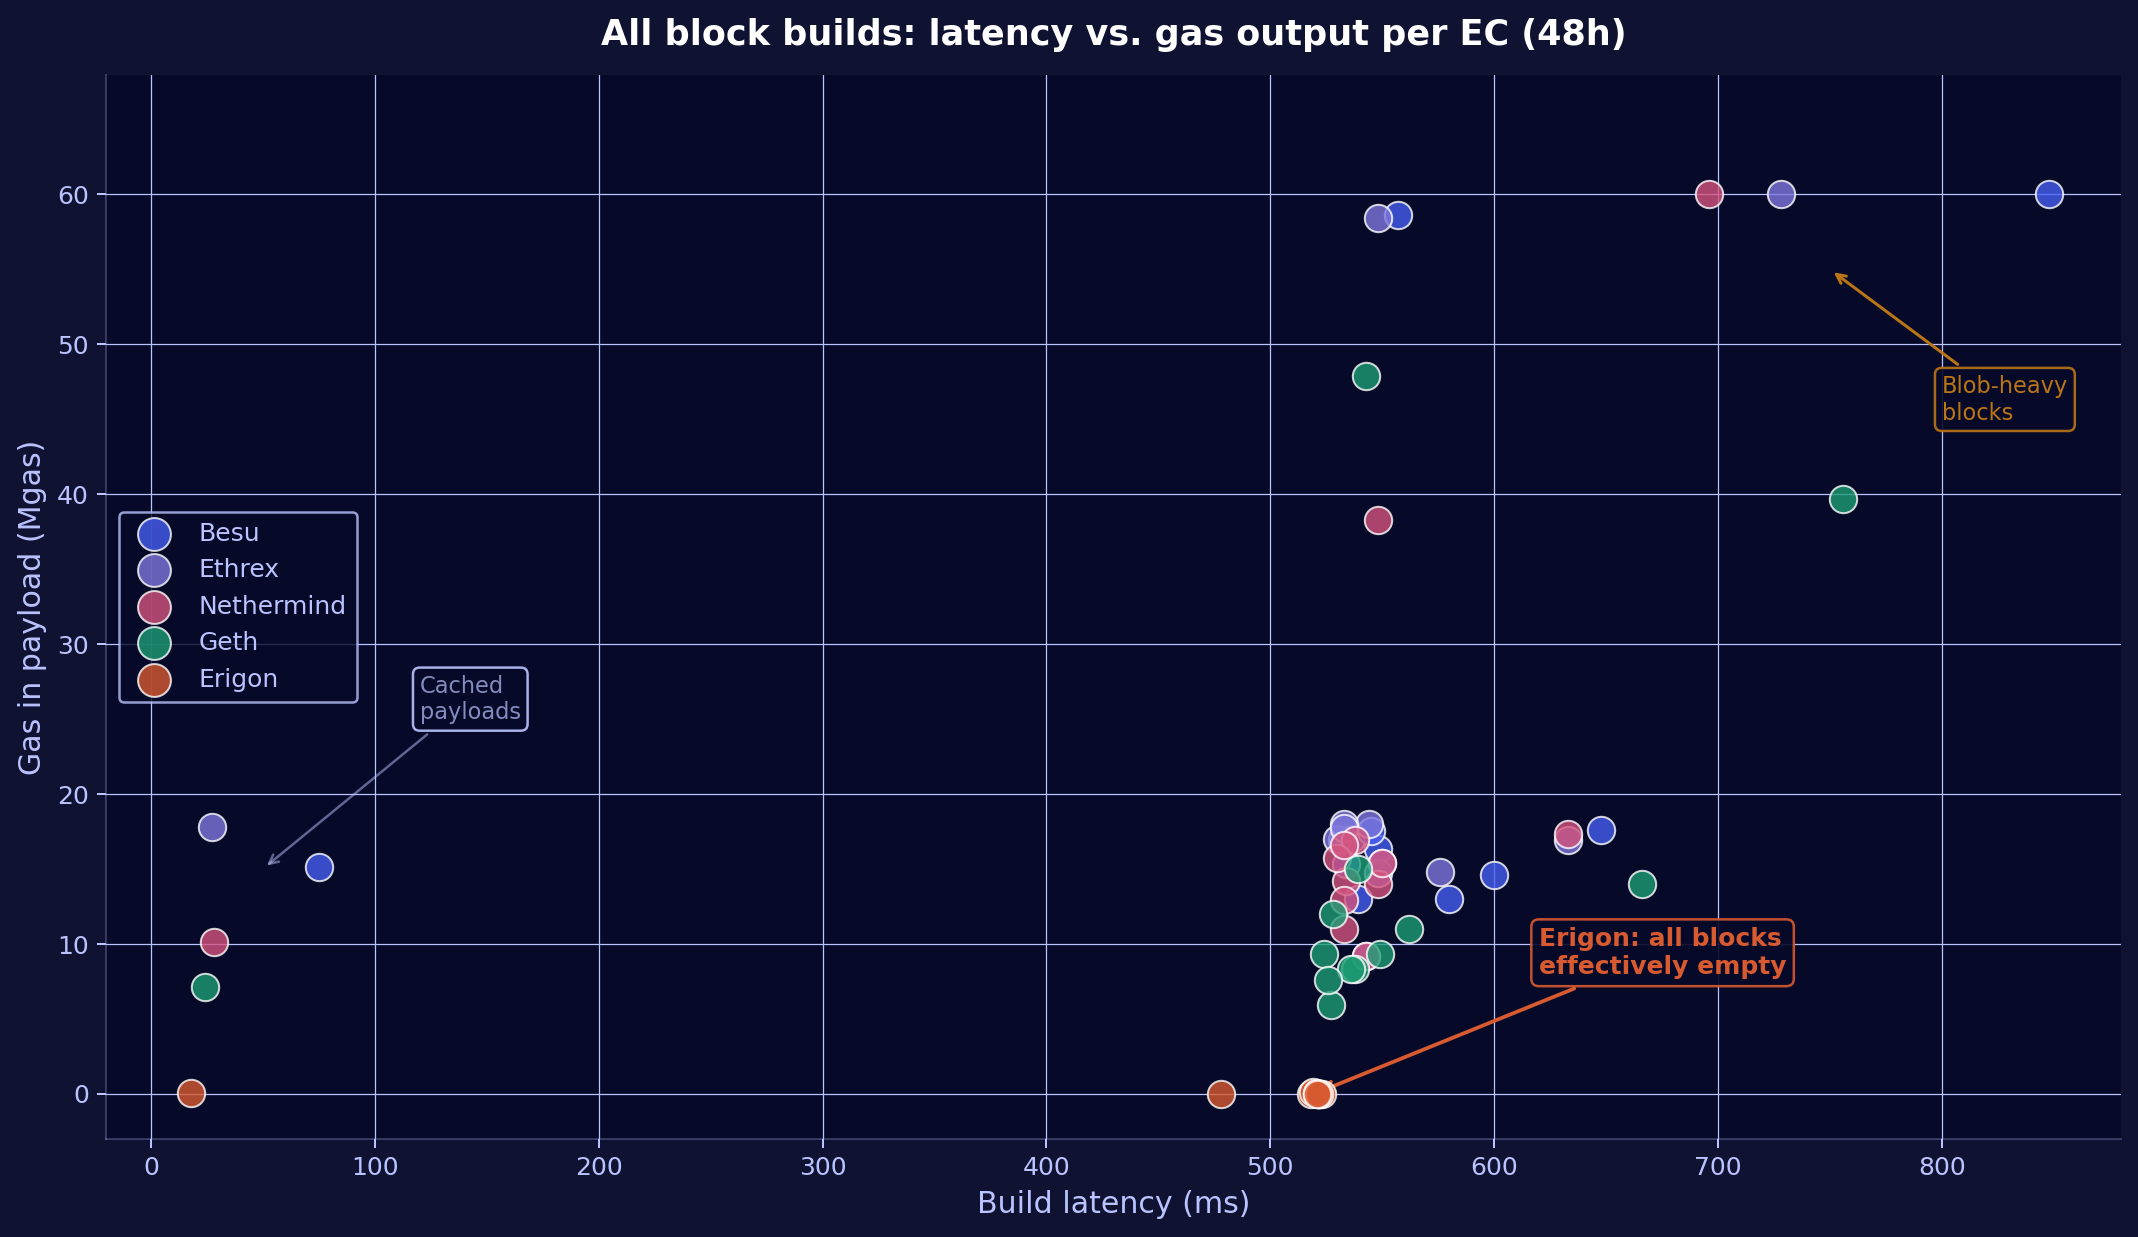
Three distinct patterns emerge:
Standard blocks (500-650ms, 7-18 Mgas): The main cluster where most builds land. Besu, Ethrex, and Nethermind consistently occupy the upper band (14-18 Mgas), while Geth sits lower (7-15 Mgas). All four ECs overlap in latency, confirming that response time differences between them are marginal for regular blocks.
Blob-heavy blocks (700-850ms, 38-60 Mgas): A few outlier slots where blob transactions push gas usage to 38-60M. These blocks take noticeably longer to build across all ECs, with Besu and Ethrex reaching the gas limit (60M) while Geth tops out around 40-48M. The latency increase is proportional to payload complexity.
Erigon (480-520ms, 0 Mgas): Every single Erigon build sits flat on the x-axis at 0 gas, forming a tight horizontal cluster. Regardless of whether the same slot produced a 17M gas block on Besu or a 60M gas block on Ethrex, Erigon delivered an empty payload. This pattern is consistent across all 12 blocks with no exceptions.
The scatter also reveals a handful of cached payloads (sub-100ms) where all ECs returned near-instantly, likely from a previously prepared payload that Nimbus retrieved before the build window elapsed.
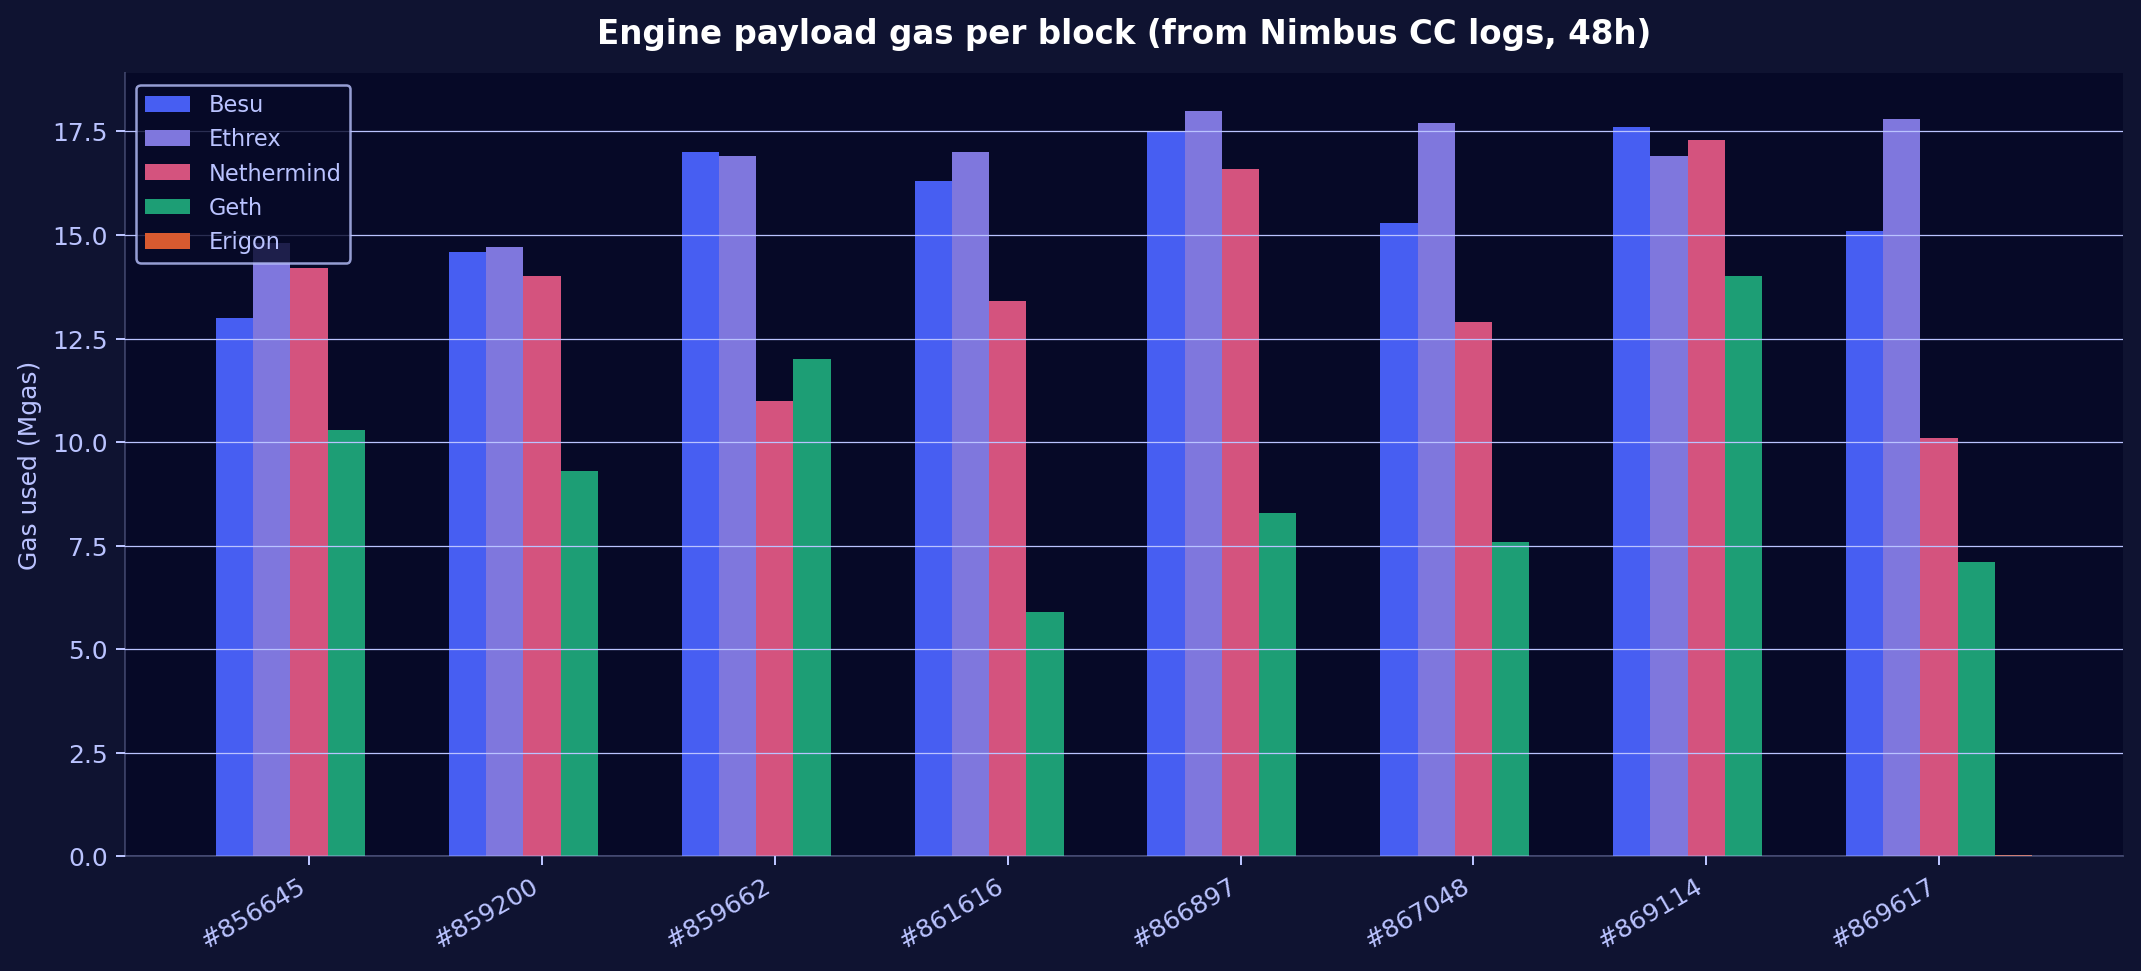
Cross-EC payload comparison
By examining the Received engine payload log from all 5 Nimbus CC instances, we can compare the actual gas_used delivered by each EC for the same blocks:
| EC | Block #869114 | Block #869617 | Block #867424 | Block #866897 | Avg gas |
|---|---|---|---|---|---|
| Besu | 17.6M | 15.1M | 13.0M | 17.5M | ~23.5M |
| Ethrex | 16.9M | 17.8M | 18.0M | 18.0M | ~21.8M |
| Nethermind | 17.3M | 10.1M | 15.4M | 16.6M | ~21.2M |
| Geth | 14.0M | 7.1M | 11.0M | 8.3M | ~15.0M |
| Erigon | 0 | 41K | — | 0 | ~0 |
Besu, Ethrex, and Nethermind are the strongest block builders, routinely filling blocks to 15-30% gas utilization. Ethrex is particularly consistent, delivering 14-18M gas for standard blocks. Geth produces lighter payloads. Erigon's payloads are effectively empty.
Besu: the most aggressive builder
Besu produced 661 block improvement iterations across its built blocks. Its logs show the full iterative building process with reward tracking:
New proposal for payloadId 0x36f36d block 24869114
  gas used 17,624,773  transactions 366  reward 2.22 finney
  is better than the previous one by 103.24 szabo
For block #24,869,114, Besu's best build reached 366 transactions, 17.6M gas, and a 2.22 finney block reward. It logged every improvement step, including the marginal reward increase between iterations.
Geth: clean lifecycle, strong output
Geth logged 214 payload updates and provides the clearest view of the block building lifecycle:
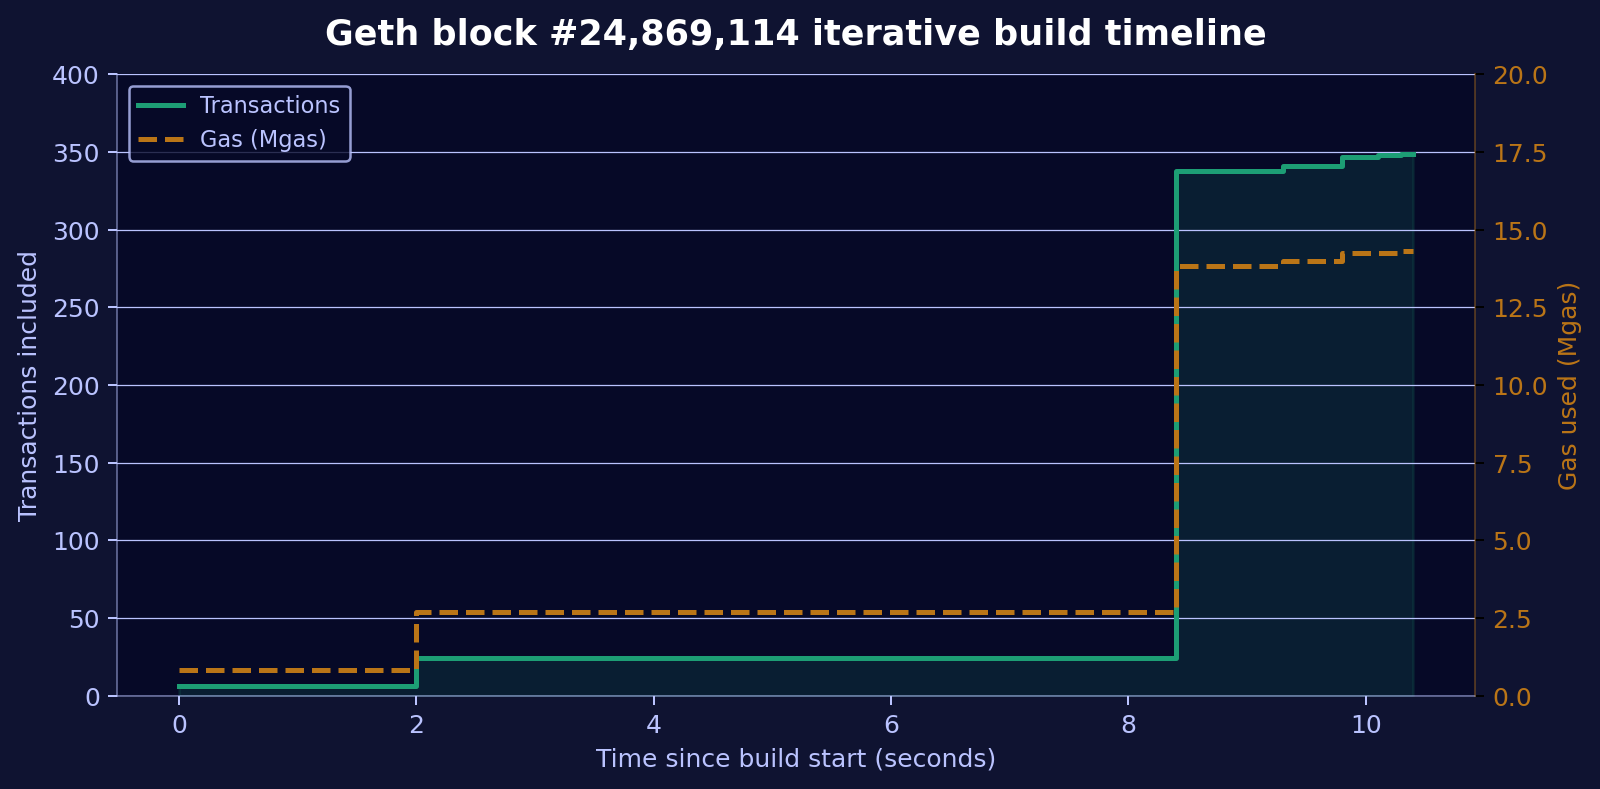
The build started with 6 transactions and grew to 349 transactions over ~10.5 seconds, with each update taking 25-67ms. Geth logs Starting work on payload, then multiple Updated payload entries (with txs, gas, fees, elapsed time), and finally Stopping work on payload reason=delivery when Nimbus retrieves the result.
Ethrex: strong builder, detailed execution breakdown
Ethrex does not log block building progress in its own container logs at the default log level. However, Nimbus' CC logs reveal it is one of the strongest builders in the fleet, delivering 21.8 Mgas on average with one block hitting 100% gas utilization (60M gas). Each payload carries extra_data: ethrex 9.0.0.
What Ethrex does log is an excellent per-block execution breakdown when processing incoming blocks:
BLOCK EXECUTION THROUGHPUT (24869233): 0.366 Ggas/s
  TIME SPENT: 55 ms. Gas Used: 0.020 (33%), #Txs: 134
  block validation: 1% | exec(w/merkle): 91% | merkle-only: 2% | store: 7%
This level of transparency into where execution time is spent (91% in execution+merkle, 7% in storage, 1% in validation) is unique among the tested ECs and valuable for performance profiling.
Nethermind: strong builder, quiet logs
Nethermind's own logs only show production requests (Production Request 24869114 PayloadId: 0x2321052e5846b8a2) without per-iteration detail at the default log level. However, Nimbus' CC logs reveal the full picture:
INF Received engine payload  slot=14103195 payload="(block_number: 24869114,
  gas_used: 17257515, gas_limit: 60000000, extra_data: Nethermind v1.36.2, ...)"
For block #24,869,114, Nethermind delivered 17.3M gas, competitive with Besu's 17.6M and Ethrex's 16.9M. Across all 13 payloads in 48h, Nethermind consistently produced blocks in the 9-17M gas range.
Erigon: severely impaired block building
Erigon's own logs show it actively attempts to build blocks but consistently fails to include transactions:
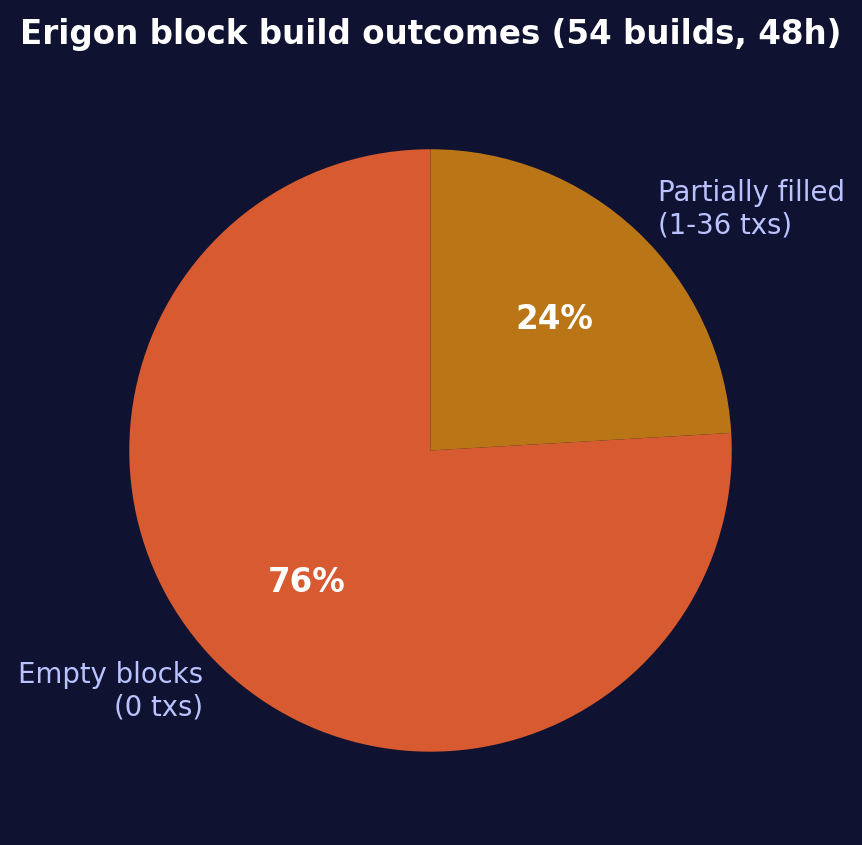
76% of Erigon's 54 block build iterations produced completely empty blocks with 0 transactions and 0 gas. When it did include transactions, the count was dramatically lower than other clients: a maximum of 36 transactions versus 300+ for Besu and Geth.
Built block  height=24869114  txs=0  executionRequests=0
  gas used %=0.000  time=782.686ms
The Nimbus CC logs confirm this: across 12 blocks, every single payload from Erigon contained 0 or near-0 gas. This is not a latency issue. At 479ms average, Erigon is the fastest EC to return a payload. The problem is upstream: Erigon's block execution latency (423-567ms per imported block) delays transaction pool maintenance, so when Nimbus asks for a payload, Erigon has nothing to put in it.
In a production setup, if Erigon were the EC responsible for building the block that gets submitted to the network, the validator would propose a near-empty block, forfeiting transaction fees and MEV revenue. For the ~13 blocks built in our 48h window, the difference between Besu's output (2.22 finney reward) and Erigon's (0 reward) is a direct loss per proposal.
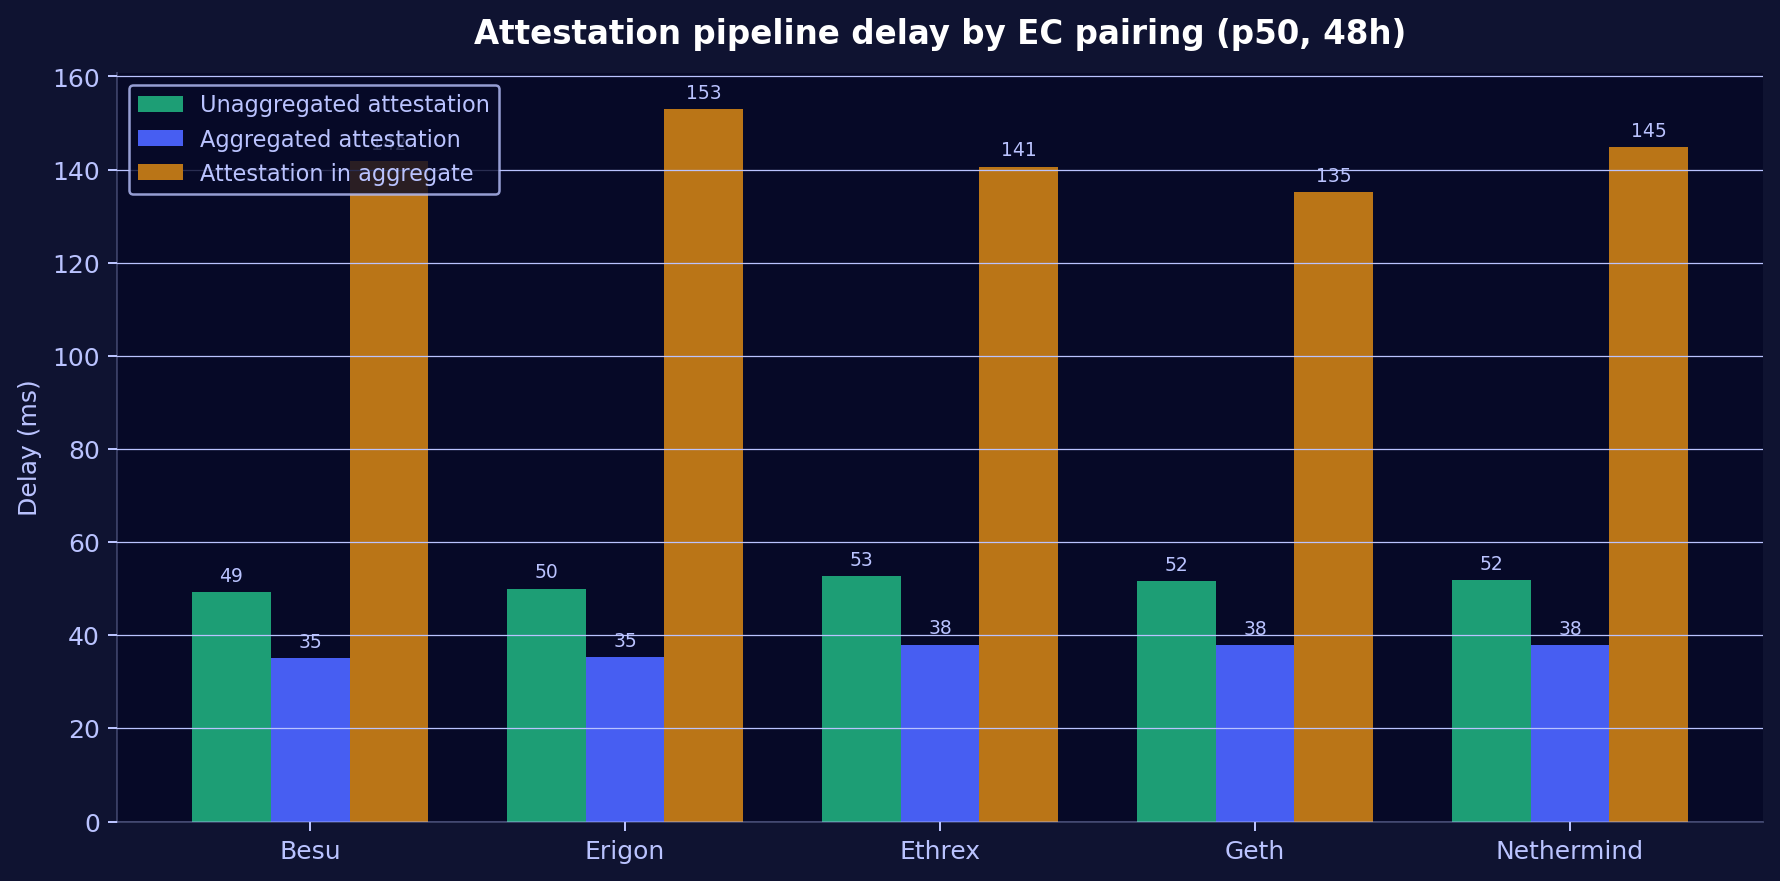
Attestation pipeline: per-EC timing differences
While all 5 nodes observe the same 1,000 validators and see identical on-chain results (99.996% attestation inclusion rate), how quickly each node observes attestation events varies by EC pairing. Three pipeline stages were measured:
| Pipeline stage | Besu | Erigon | Ethrex | Geth | Nethermind | Spread |
|---|---|---|---|---|---|---|
| Unaggregated attestation (p50) | 49ms | 50ms | 53ms | 52ms | 52ms | 4ms |
| Aggregated attestation (p50) | 35ms | 35ms | 38ms | 38ms | 38ms | 3ms |
| Attestation in aggregate (p50) | 142ms | 153ms | 141ms | 135ms | 145ms | 18ms |
Besu is the fastest for raw attestation observation. However, Geth leads in the third stage (attestation appearing inside aggregates), which is the most relevant for actual inclusion. Erigon is consistently the slowest in this final stage, adding 18ms of latency versus Geth. Ethrex performs well across all three stages.
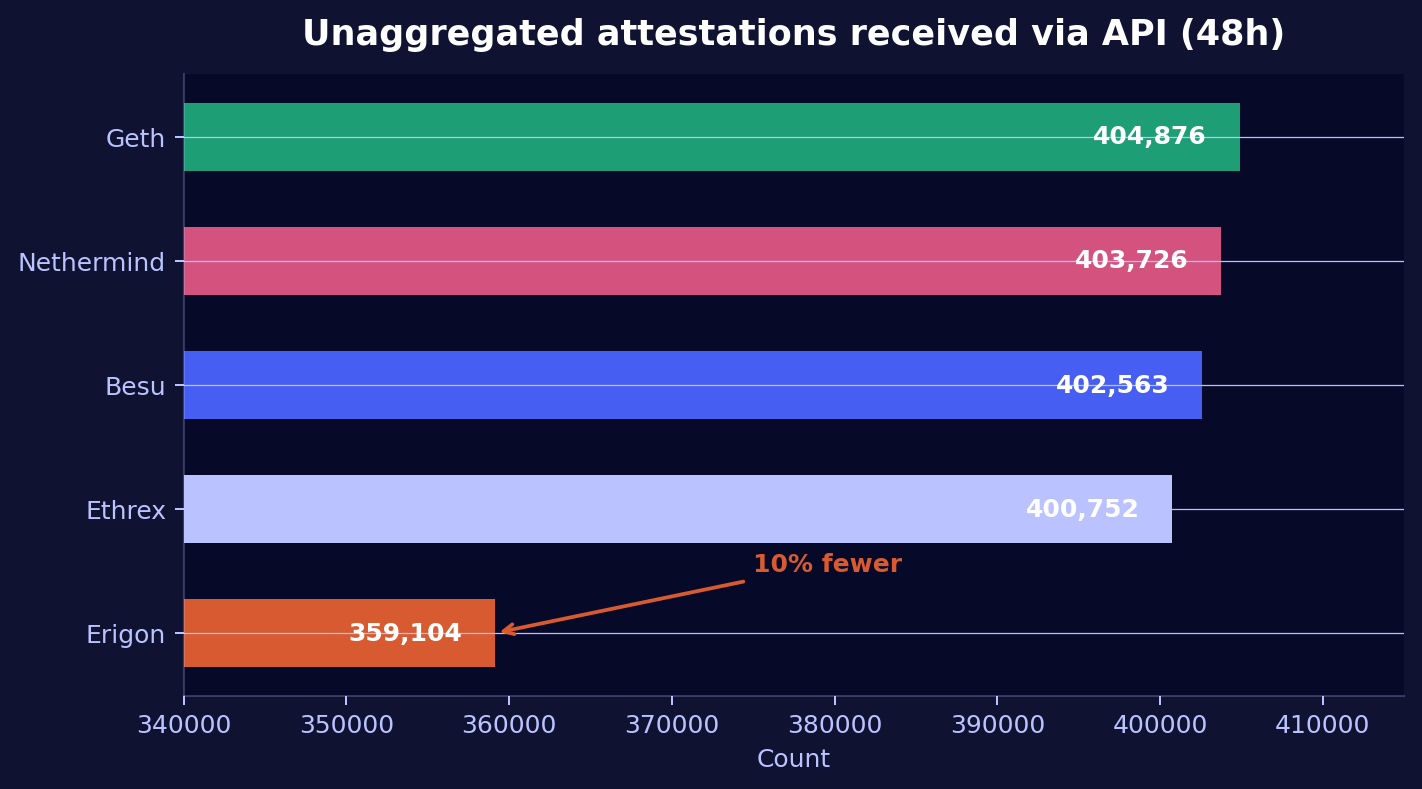
Attestation volume: Erigon's observation gap
All 5 nodes should see roughly the same number of attestations for the monitored validators. Over 48 hours, they do not:
| EC pairing | Attestations received (API) | Delta vs. best |
|---|---|---|
| Geth | 404,876 | baseline |
| Nethermind | 403,726 | -0.3% |
| Besu | 402,563 | -0.6% |
| Ethrex | 400,752 | -1.0% |
| Erigon | 359,104 | -11.3% |
Erigon misses ~45,000 attestations that the other 4 nodes see within the same 48-hour window. This is not a network issue; all nodes are on the same bare-metal fleet in Vienna. Erigon's slower block processing causes attestations to expire before the node can process them.
Vote accuracy: source, target, and head
The 1,000 monitored validators' three Casper FFG vote types show dramatically different difficulty levels:
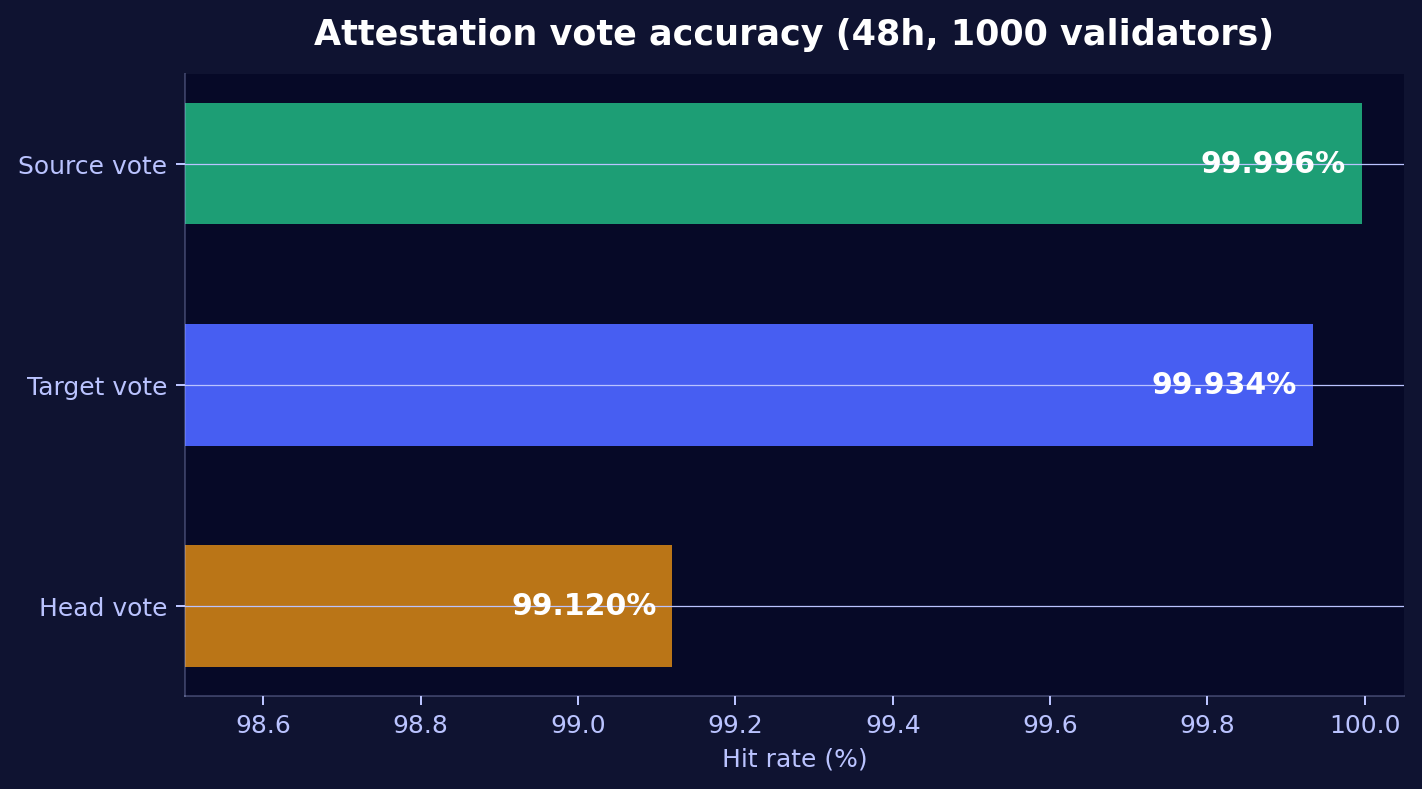
| Vote type | Hits (48h) | Misses (48h) | Hit rate | What it measures |
|---|---|---|---|---|
| Source | 450,137 | 19 | 99.996% | Correct justified checkpoint |
| Target | 449,857 | 299 | 99.934% | Correct finalized checkpoint |
| Head | ~446,200 | ~3,987 | 99.12% | Correct chain head at slot boundary |
Head vote accuracy is the hardest duty, with ~210x more misses than source. It requires the node to see the latest block before the slot boundary, making it the most sensitive to processing speed.
Head vote: diurnal pattern
Over 48 hours, head vote accuracy shows a clear cyclic pattern:
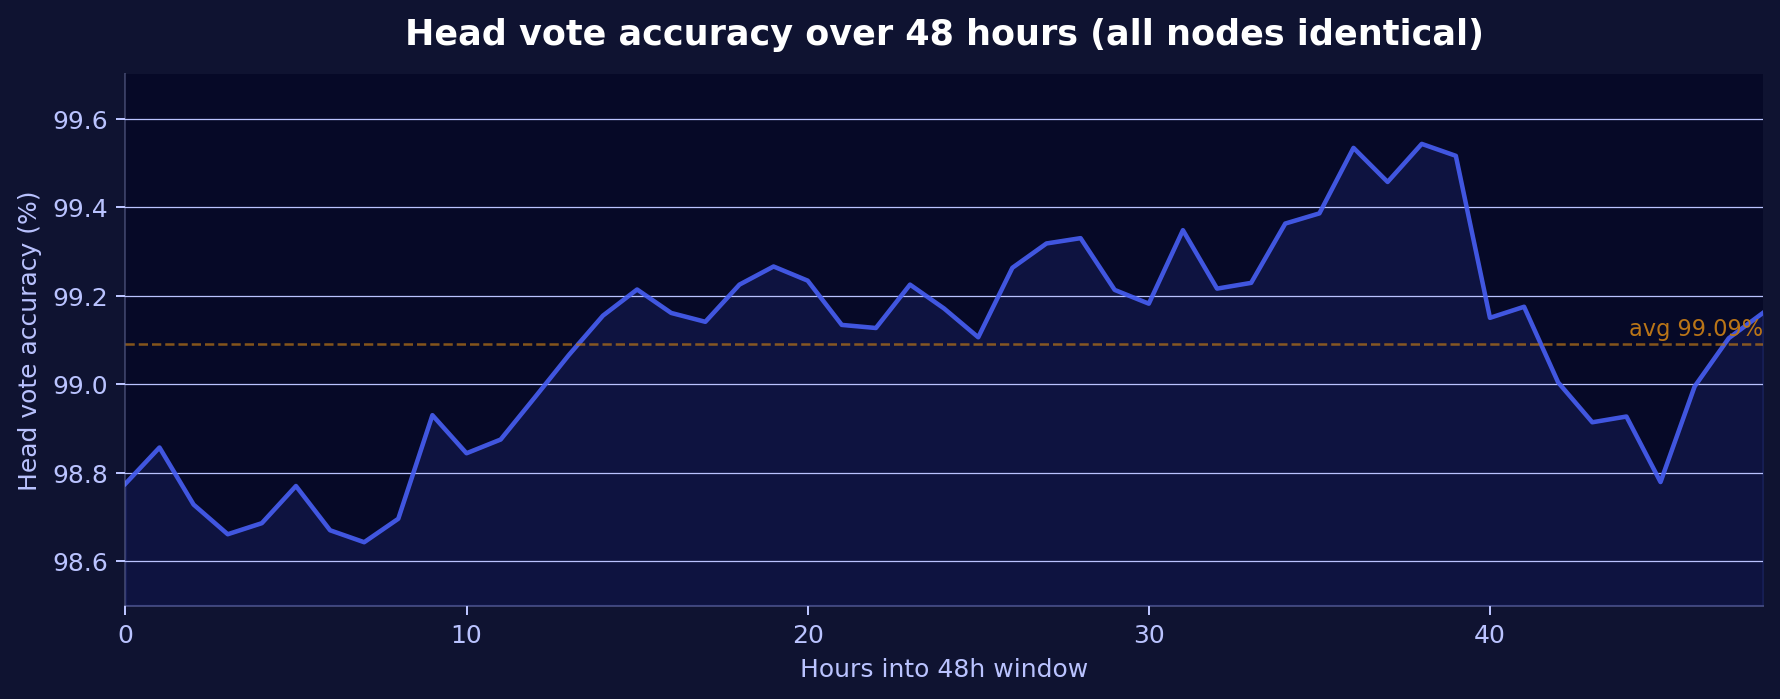
The rate fluctuates between 98.64% and 99.54%, likely driven by network congestion patterns. All 5 nodes report identical values at each time point, confirming this reflects on-chain truth, not individual node performance.
Block proposals via gossip
Over the monitoring period, the nodes observed 27 block proposals from the 1,000 monitored validators via gossip. In the last 48 hours, 12 block proposals were detected via the validator_monitor_block_hit_total counter. All proposals arrived via the gossip network, confirming the validators are actively proposing on-chain.
Nimbus CC logs as an observability source
One of the practical takeaways from this analysis: Nimbus' consensus client logs are a valuable observability layer for block building, regardless of how detailed the execution client's own logs are.
Nimbus logs three key events per block building cycle:
Requesting engine payload— timestamp, slot, beacon head, fee recipientReceived engine payload— full payload contents: gas_used, gas_limit, block_number, extra_dataBlock proposal included— slot, validator ID
For Ethrex and Nethermind, whose default log levels don't expose per-iteration block building details, the Nimbus CC logs were the only way to determine that both clients are strong builders (17-22M gas avg). This CC-side perspective also revealed the build latency data that showed Erigon's problem is not response time but empty transaction pools.
EC log verbosity at default levels
An interesting infrastructure finding: the default log levels produce vastly different volumes across execution clients.
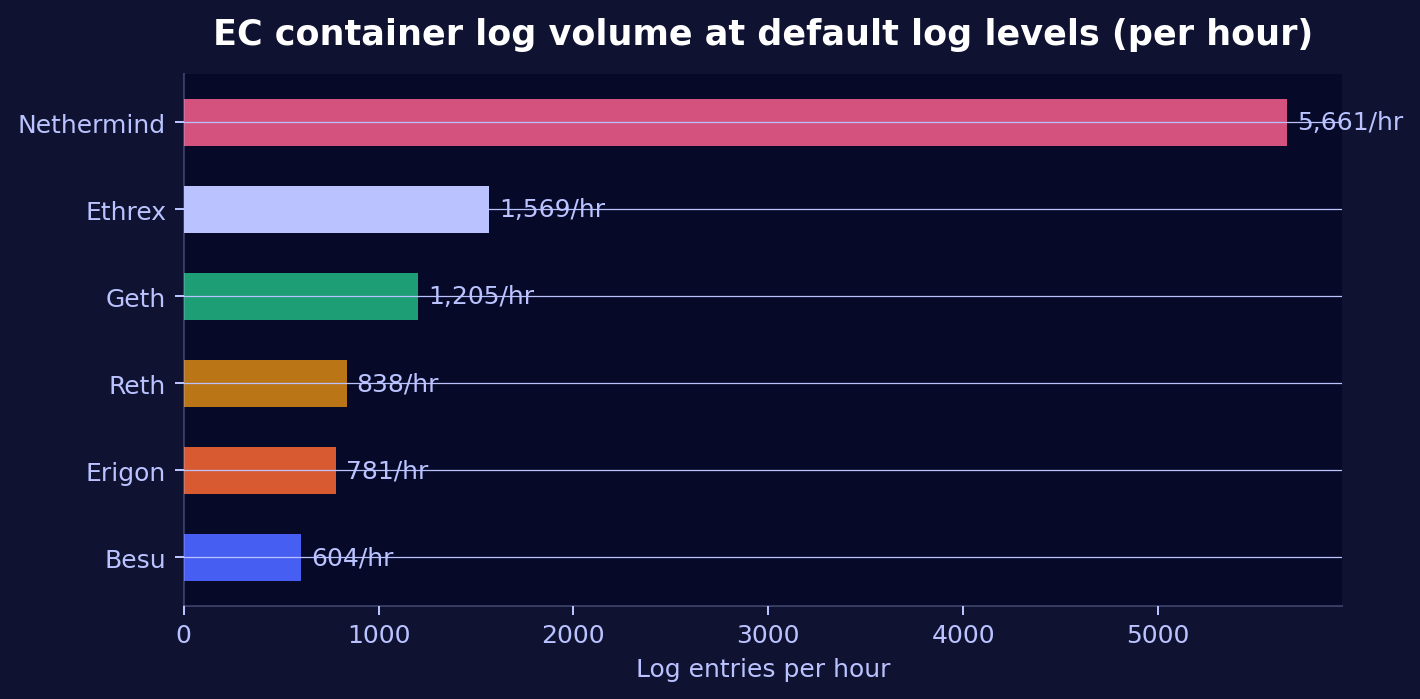
| Execution Client | Log entries per hour | Factor vs. least |
|---|---|---|
| Nethermind 1.36.2 | 5,661 | 9.4x |
| Ethrex 9.0.0 | 1,569 | 2.6x |
| Geth v1.17.2 | 1,205 | 2.0x |
| Reth v1.11.3 | 838 | 1.4x |
| Erigon v3.3.10 | 781 | 1.3x |
| Besu 26.2.0 | 604 | 1.0x |
Nethermind produces ~9x more log output than Besu at default log levels. All 6 ECs in our fleet (including Reth, which is syncing) are included here since this is a general infrastructure observation.
If you're running Nethermind with centralized logging (Filebeat/Elasticsearch or similar), account for its higher log volume when sizing your log storage and ingestion capacity. Consider adjusting Nethermind's log level if storage is constrained.
Summary
| Dimension | Besu | Erigon | Ethrex | Geth | Nethermind |
|---|---|---|---|---|---|
| Block building (avg gas) | 🟢 23.5M (best) | 🔴 0M (empty) | 🟢 21.8M | ⚪ 15.0M | 🟢 21.2M |
| Build latency | 546ms | 479ms (fastest) | 535ms | 524ms | 519ms |
| Attestation delay (agg.) | ⚪ 142ms | 🔴 153ms | ⚪ 141ms | 🟢 135ms | ⚪ 145ms |
| Attestation volume | ⚪ -0.6% | 🔴 -11.3% | ⚪ -1.0% | 🟢 Baseline | ⚪ -0.3% |
| EC build log detail | 🟢 Full | ⚪ txs + gas | 🟠 None (CC fills gap) | 🟢 Full | 🟠 Minimal (CC fills gap) |
| Log verbosity (default) | 🟢 604/hr | ⚪ 781/hr | ⚪ 1,569/hr | ⚪ 1,205/hr | 🟠 5,661/hr |
Key takeaways
-
Erigon's block building is severely impaired. 76% of built blocks were empty, and even when it did include transactions, the count was a fraction of what other clients achieved. Paradoxically, Erigon responds fastest (479ms) but with nothing in the payload. The root cause is its slow block execution (423-567ms) cascading into transaction pool readiness.
-
Besu, Ethrex, and Nethermind are all strong block builders. Besu leads on raw gas output (23.5M avg) and iteration count (661 per block). Ethrex is the most consistent (14-18M gas for standard blocks, 60M for full blocks). Nethermind is competitive at 21.2M avg despite minimal logging.
-
Nimbus' CC logs are a valuable observability source. The
Received engine payloadlog provides payload gas_used, build latency, and block details for every EC, making it the most reliable cross-client comparison tool, especially for ECs like Ethrex and Nethermind whose own logs lack block building detail at default levels. -
Erigon misses ~11% of attestation observations due to slower block processing. This volume gap is unique to Erigon; the other 4 ECs are within 1% of each other.
-
Head vote accuracy (~99.1%) shows a diurnal pattern visible across all nodes identically, driven by network congestion rather than client behavior.
-
Log volume varies 9x between the most and least verbose EC at default log levels. Nethermind's high verbosity (5,661/hr) is an infrastructure sizing consideration.
Methodology notes
All Prometheus data sourced from the prometheus-cold datasource in the StereumLabs Grafana instance. Validator monitor metrics use the validator_monitor_* family with cc_client="nimbus" and validator="total" label selectors. 48-hour data uses increase(...[48h]) instant queries and histogram_quantile over rate(...[48h]) for delay distributions.
EC container logs are stored in Elasticsearch (Filebeat 9.3.0 → Elasticsearch 9.3.0) and queried via the container.image.name field to isolate each execution client's output. Block building logs were identified by client-specific patterns: Besu's New proposal for payloadId, Geth's Updated payload/Starting work on payload/Stopping work on payload, and Erigon's Built block/Building block.
Additionally, Nimbus CC container logs (statusim/nimbus-eth2:multiarch-v26.3.1) were analyzed for engine API interactions: Requesting engine payload (build request timestamps), Received engine payload (payload contents including gas_used), and Block proposal included (on-chain confirmation). This CC-side perspective provides build latency measurements and fills in payload details for ECs whose own logs lack that information at default log levels (notably Ethrex and Nethermind).
All nodes run on NDC2 bare-metal hardware (Vienna), eliminating cloud-induced variance.
For details on our label conventions and how to build your own dashboards against our data, see Build your own dashboards.