7 posts tagged with "Nimbus"

View All Tags

Where the slot goes: six instruments, calibrated

· 26 min read
Stefan Kobrc
Founder RockLogic
StereumLabs AI
Artificial Intelligence

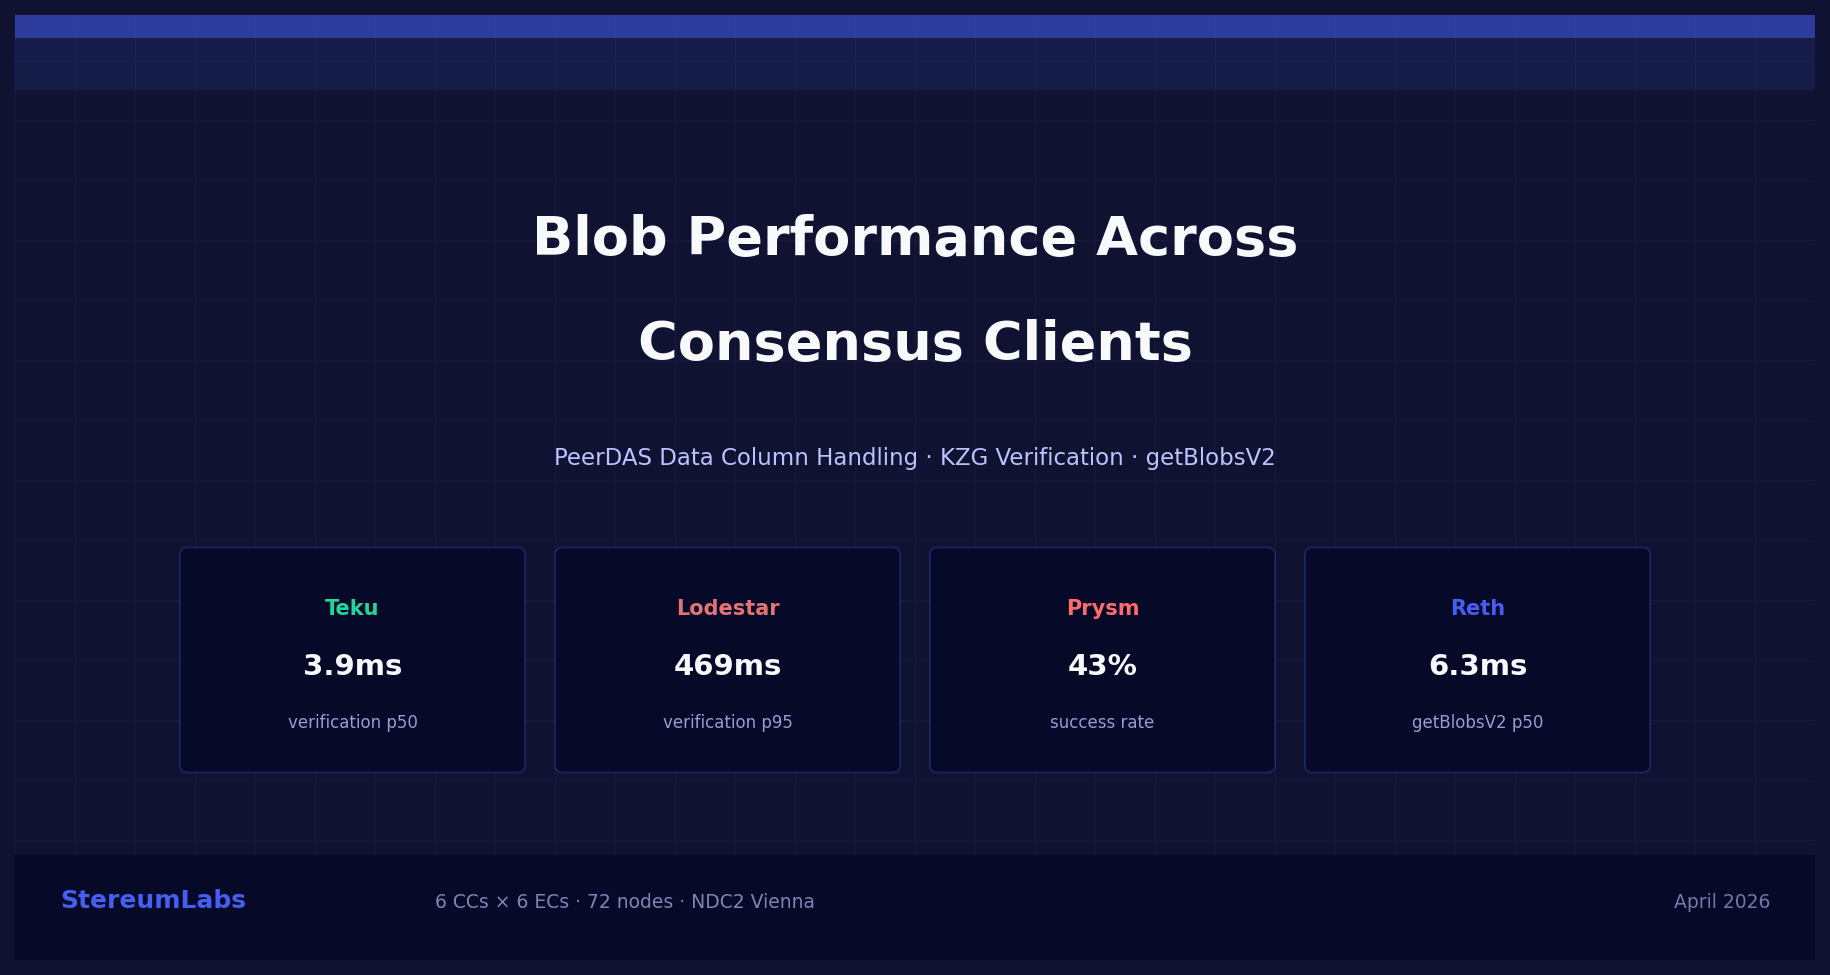
Over three days in August, Lodestar timed 21,530 newPayload calls to its Ethrex peer and reported a mean of 372.6 ms; Ethrex timed the same calls from its own end of the same socket and reported 164.8 ms. Both figures are right as far as the client reporting them is concerned, since the two stopwatches start and stop at different points, but the 208 ms between them is larger than most of the differences this series has spent six editions measuring between execution clients.

For six editions we compared execution clients through whichever consensus client happened to be watching them, and it took until the sixth to work out how much of what we were reading belonged to the watcher rather than the watched. Six consensus clients run against the same fleet here, no two of them measure a slot the same way, and one of them cannot produce a mean for the engine call at all.

Where the slot goes: Prysm, and what survives three instruments

· 20 min read
Stefan Kobrc
Founder RockLogic
StereumLabs AI
Artificial Intelligence

The first two editions of this series each had one instrument. Under Lighthouse we used its block-delay gauges and found the execution client moved the would-fail-attestation rate up to 3.7x. Under Nimbus we used its arrival histogram and found it could not separate execution clients at all. Prysm gives us fine-grained histograms of both engine calls, one entry per slot, which is what we came for. It also gave us something we did not plan on: enough overlap with the other two clients to put the same question to three independent instruments on three separate pairings, in the same three days, on identical execution-client versions.

That triangulation is the finding, and it changes how we read our own earlier editions. Two results survive all three instruments: Ethrex is the fastest execution client on newPayload and Erigon the slowest, and Besu spends around 200 ms on forkchoiceUpdated while it is a single-digit or low-double-digit call for the rest. Almost nothing else does. The middle of the field, Geth against Nethermind against Besu, permutes depending on which client you ask. The reason is not the metric definition, and it is not the hardware either. At a fixed version, the same execution client's own internal timer varies by 160 ms depending on which consensus client is driving it, on machines whose load and database size are indistinguishable. That is larger than the margins we would be ranking on.

Where the slot goes: Nimbus and the execution timing it can't see

· 15 min read
Stefan Kobrc
Founder RockLogic
StereumLabs AI
Artificial Intelligence

In the first edition of this series we measured, under Lighthouse, where a 12-second slot goes against the 4-second attestation deadline, and found that the execution client you pick is the lever: it shifts how often a node lands late enough to fail attestations by about 1.5x across the mainstream clients, and 3.7x once Erigon's disk-bound tail is counted. This edition runs the same six execution clients on the same bare-metal fleet, and asks the same question of Nimbus. The answer is the finding: Nimbus cannot tell you which execution client is costing you, because the one timing it reports is block arrival, and arrival is the part the execution client does not touch.

That is not a gap in our data. It is what Nimbus exposes. Where Lighthouse breaks the path to attestable into arrival, consensus verification and execution verification, Nimbus publishes a single histogram of block-arrival delay. The good news is that this histogram is complete, counting every block, not the once-a-minute sample Lighthouse's gauges gave us. The catch is that it sees only the network-and-proposer part of the slot, so the 3.7x spread that mattered under Lighthouse is simply not in the data Nimbus reports.

Ethereum reorg accounting: Prysm sees 8×, Lodestar sees 0

· 22 min read
Stefan Kobrc
Founder RockLogic
StereumLabs AI
Artificial Intelligence

A Prysm node and a Lodestar node on the same chain, on identical hardware, both export beacon_reorgs_total. Over the last 90 days, the Prysm hosts in our Vienna NDC2 fleet incremented that counter 6,011 times. The Lodestar hosts incremented it zero times. Both numbers are correct readings of what each implementation chose to count.

This post is a 90-day reorg census across that fleet plus the smaller GCP comparator cohort: every consensus client (CC) paired with every execution client (EC), against the same Ethereum mainnet, with per-host normalization. The questions we answer: which Prometheus counter to trust for which question, why the same EC behind two different CCs produces very different reorg numbers, and why a "zero reorgs" reading on some clients is silence rather than safety.

90-day Ethereum reorg counts compared across six consensus clients on identical bare-metal hardware

Key findings at a glance:

  • Prysm increments beacon_reorgs_total 8× more often than Lighthouse over 7 days. The gap shrinks to 1.6× over 90 days.
  • Lodestar's beacon_reorgs_total is 0 for the entire 90-day window. Its decline-reason counter fires roughly 54 times per host per week.
  • The same EC behind two CCs produces 2–5× different counts: Prysm + Besu reports 69 per host vs Prysm + Nethermind 280.
  • Geth is the only EC in our fleet whose Prometheus reorg counter increments at all. Nethermind and Reth export the metric but it never increments; Besu, Erigon, and Ethrex don't export one at all.
  • A single fixed beacon_reorgs_total alert threshold does not port between consensus clients. Re-baseline per CC × EC pair.

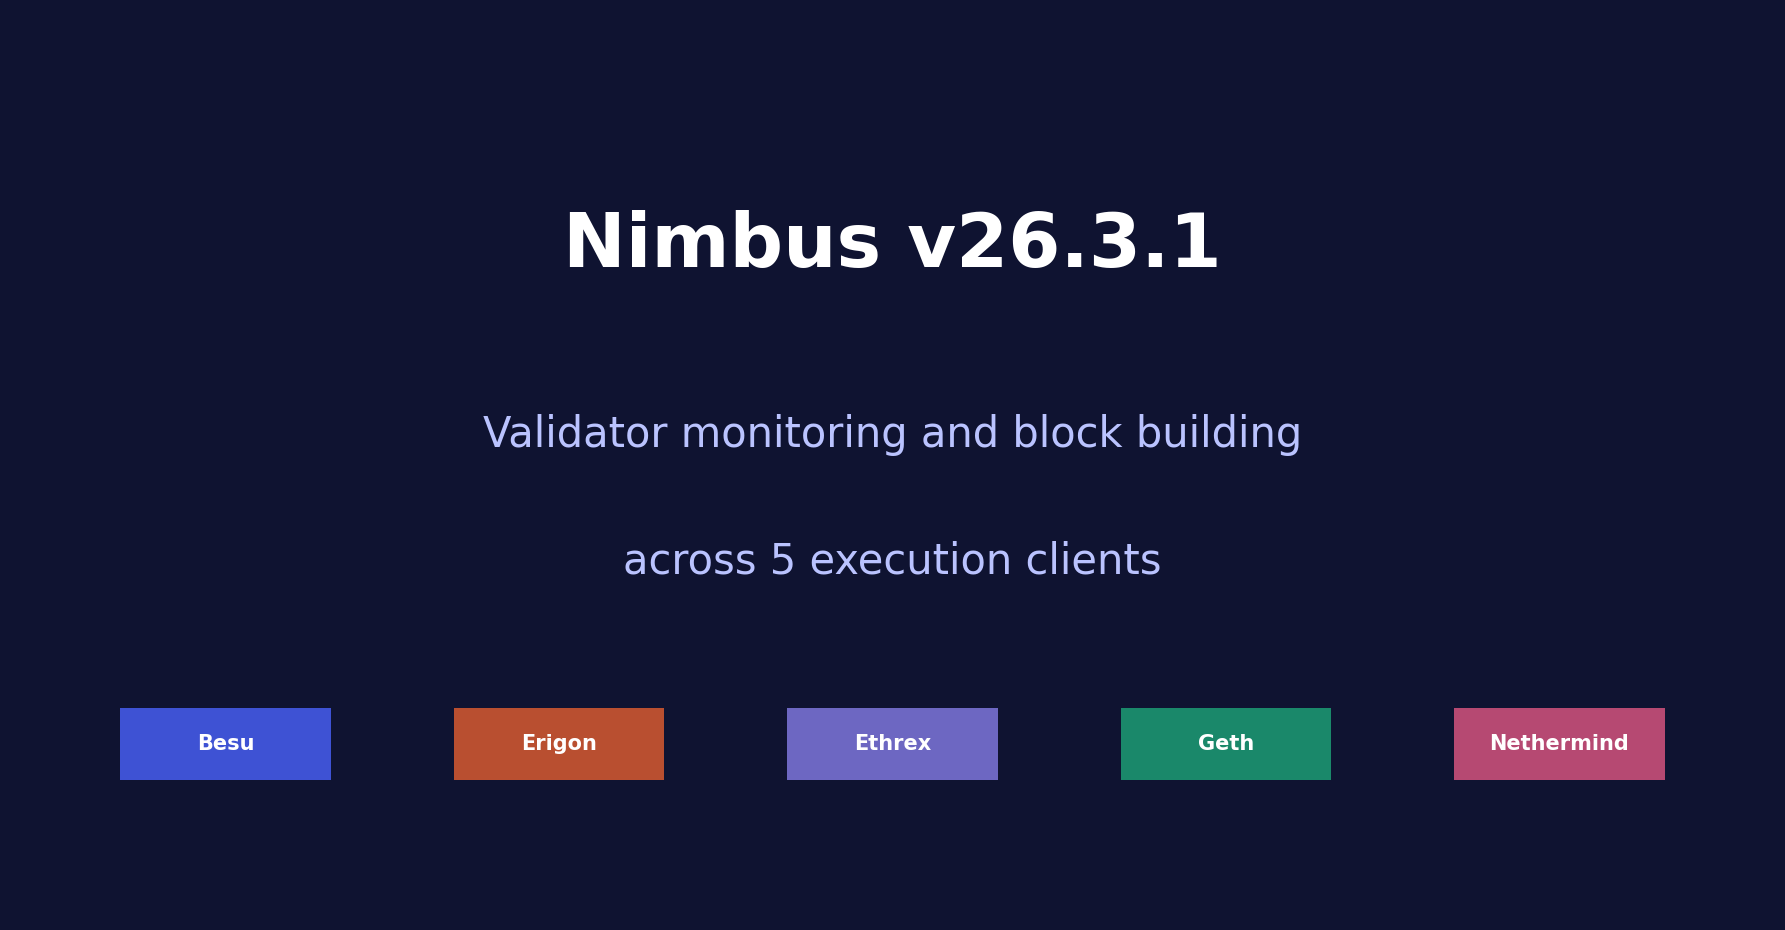
Nimbus v26.3.1: Validator monitoring and block building across 5 execution clients

· 14 min read
Stefan Kobrc
Founder RockLogic
StereumLabs AI
Artificial Intelligence

How does each execution client behave when Nimbus asks it to build a block? We monitored 1,000 validator pubkeys across 5 EC pairings for 48 hours and found that block building performance varies dramatically, with one client producing near-empty blocks while the other four packed in millions of gas.

Nimbus v26.3.1: Validator monitoring and block building across 5 execution clients