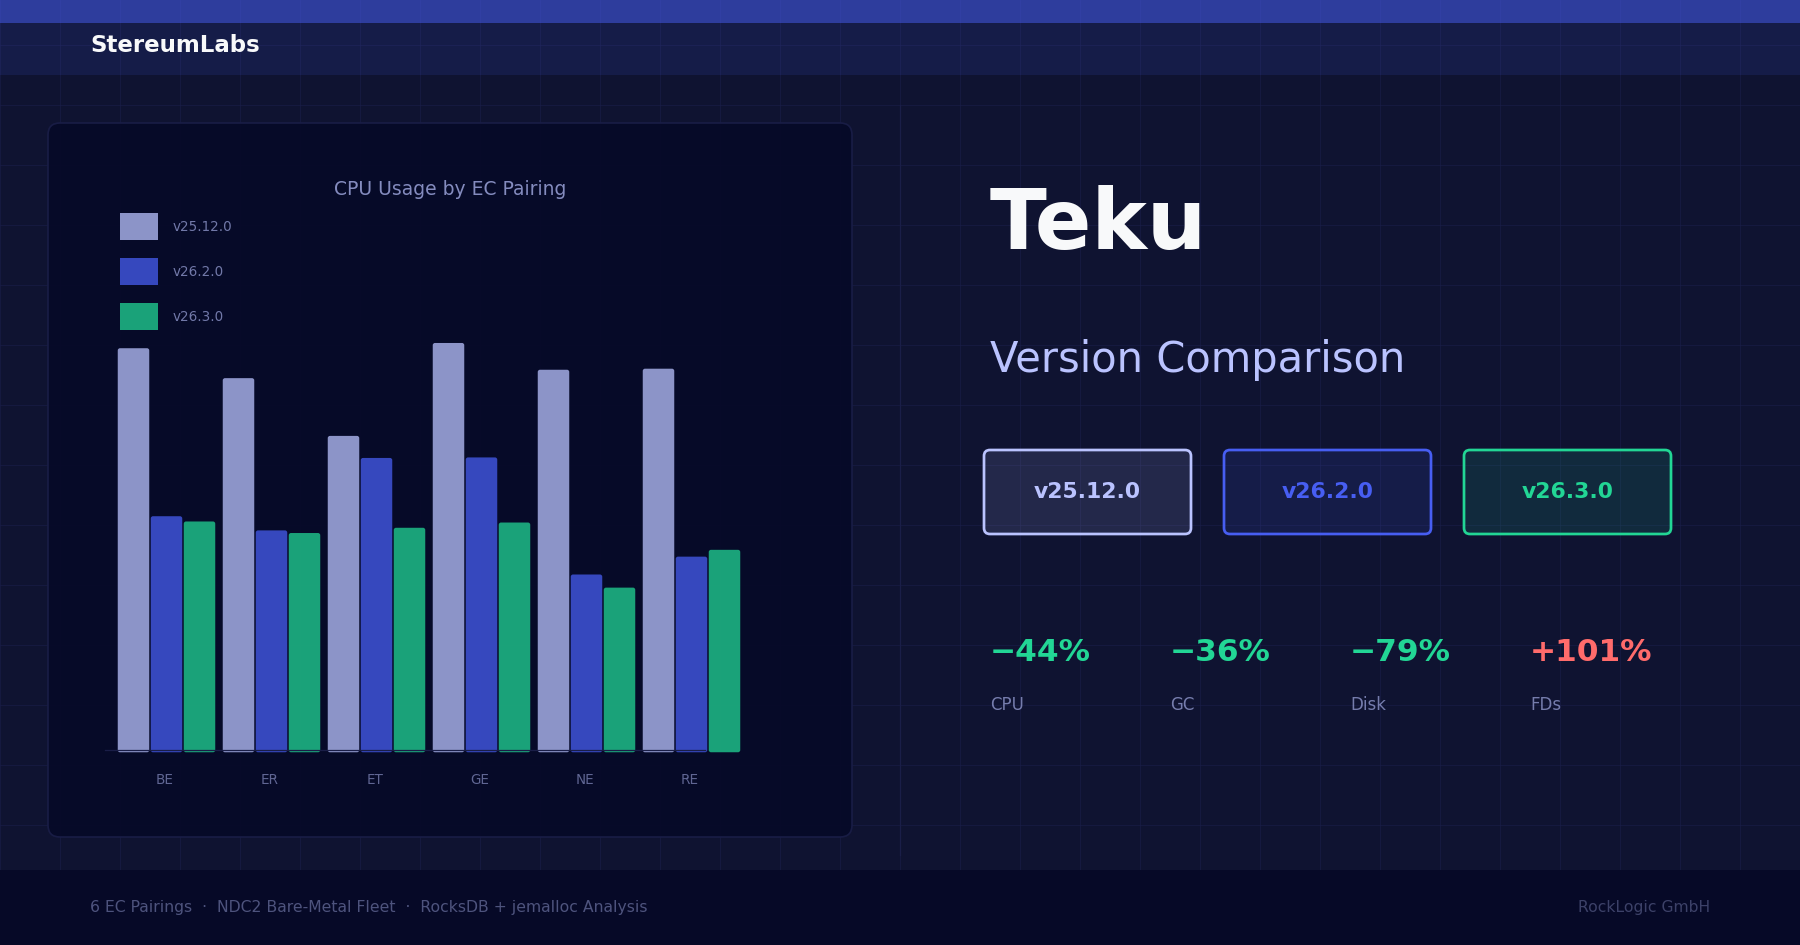
Teku 25.12.0 vs 26.2.0 vs 26.3.0: Cross-version resource & performance analysis


A deep dive into how Teku evolved across three releases: the RocksDB migration in 26.2.0, jemalloc in 26.3.0, and what both changes mean for CPU, memory, GC overhead, disk I/O, and block import latency on real hardware.
Overview
We compared three Teku consensus client versions on our NDC2 bare-metal fleet in Vienna, each paired with all 6 execution clients (Besu, Erigon, Ethrex, Geth, Nethermind, Reth). Each version was measured over a 14-day window during its active deployment period using avg_over_time(...[14d:1h]) instant queries against our Prometheus-cold datasource.
| Version | Release Date | Measurement Window | Key Changes |
|---|---|---|---|
| 25.12.0 | Dec 16, 2025 | Jan 15 – Jan 29, 2026 | Late block reorg, block building prep, sidecar recovery |
| 26.2.0 | Feb 11, 2026 | Feb 15 – Mar 1, 2026 | RocksDB as default DB, DAS backfiller, getBlobs API |
| 26.3.0 | Mar 5, 2026 | Mar 15 – Mar 29, 2026 | jemalloc allocator, SSZ serialization fix, partial sidecar import |
The full report is available as a PDF download at the bottom of this post.
Fleet-level headline numbers
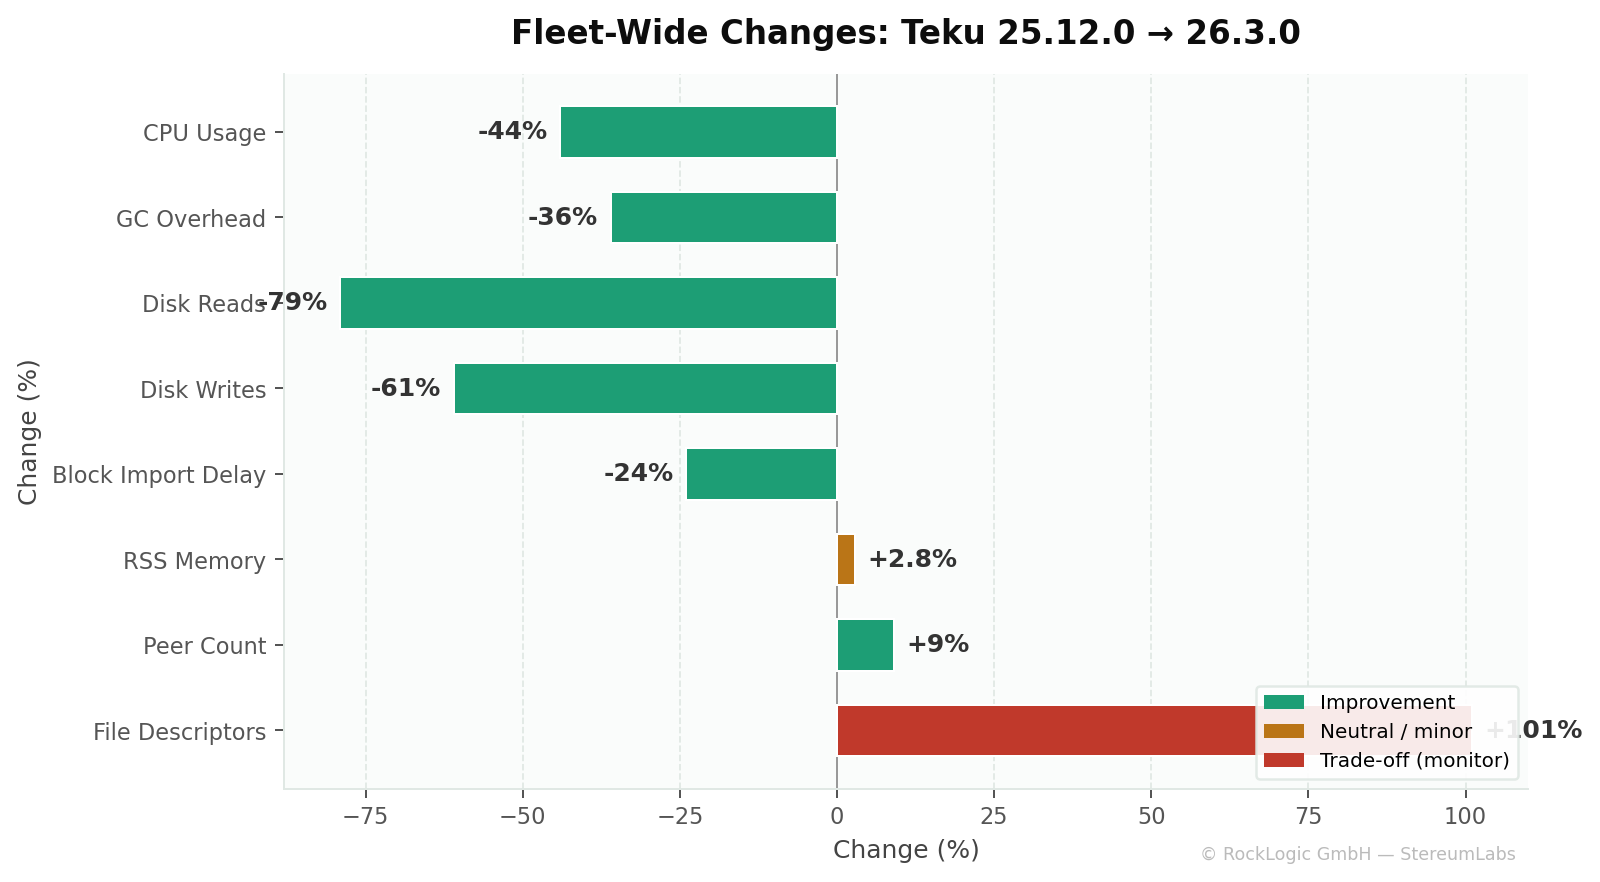
The two architectural changes — LevelDB → RocksDB in 26.2.0 and the jemalloc memory allocator in 26.3.0 — drove the majority of the performance shifts:
| Metric | 25.12.0 → 26.3.0 | What happened |
|---|---|---|
| CPU usage | −44% | RocksDB caching + jemalloc reducing GC-driven CPU spikes |
| GC overhead | −36% | jemalloc reduced heap fragmentation → fewer full GC cycles |
| Disk reads (host) | −79% | RocksDB block cache eliminates most disk reads |
| Disk writes (host) | −61% | LSM-tree architecture writes more efficiently than LevelDB |
| Block import delay | −24% | Fastest average: 297ms in 26.3.0 |
| RSS memory | +2.8% | RocksDB uses more in-memory structures (peaked at +5.5% in 26.2.0, recovered) |
| Open file descriptors | +101% | Expected: RocksDB holds many SST files open |
| Peer count (libp2p) | +9% | Steady improvement across versions |
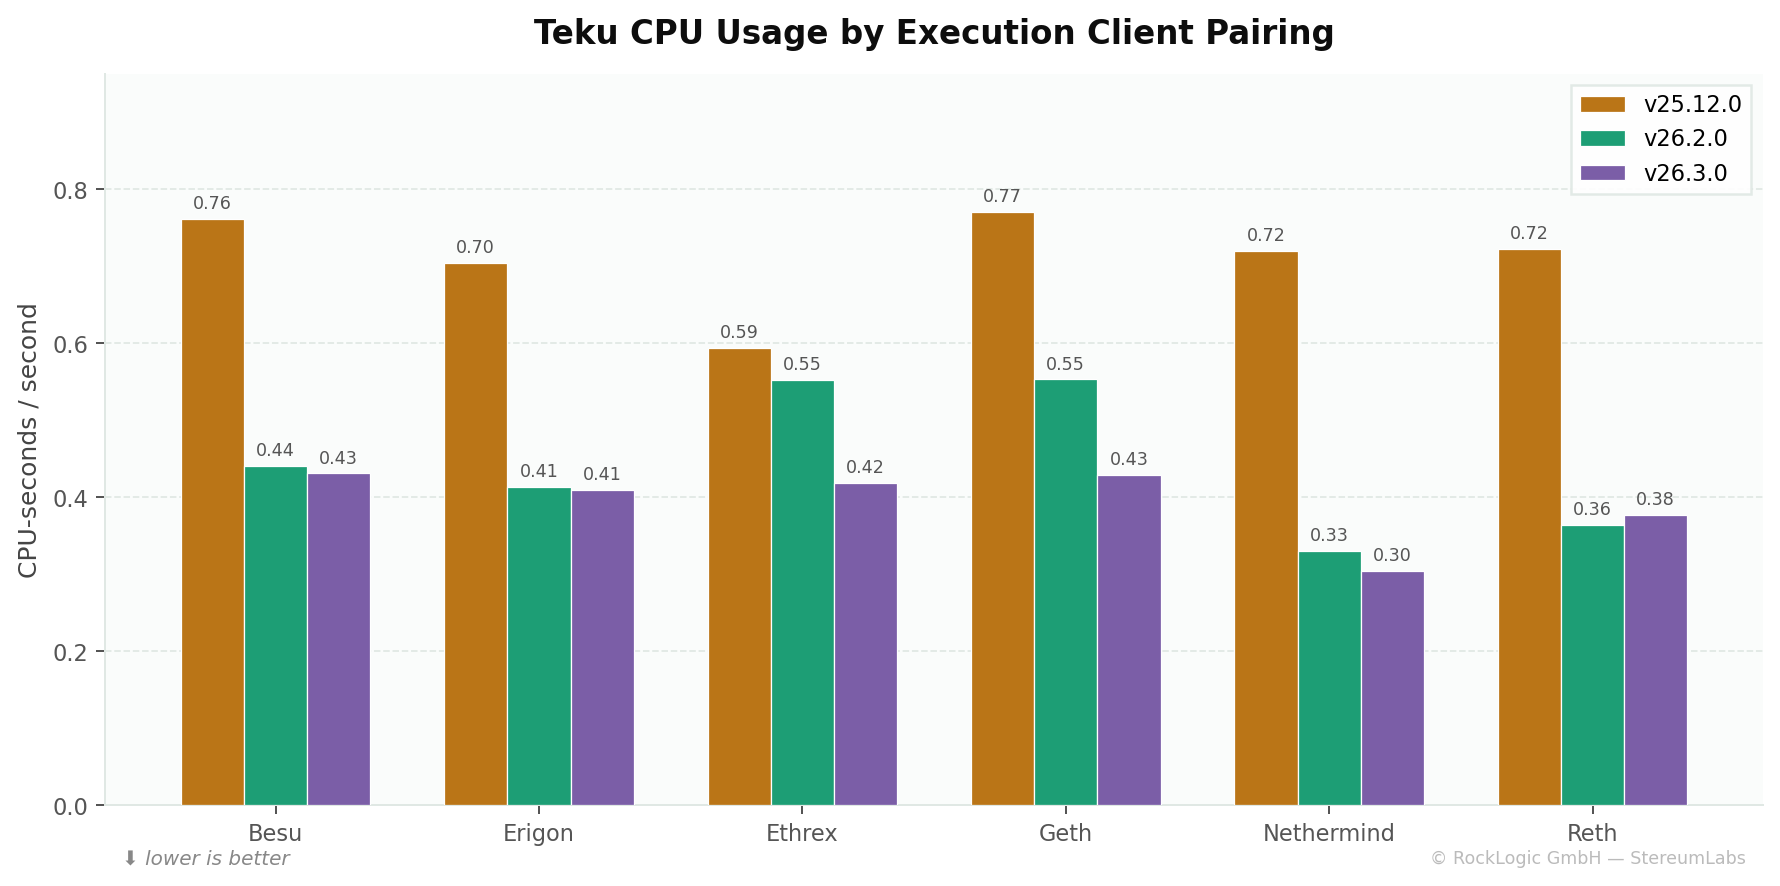
CPU utilization
Metric: rate(process_cpu_seconds_total{job="teku"}[5m]) — Teku JVM process CPU in CPU-seconds per second.
| EC Pairing | 25.12.0 | 26.2.0 | 26.3.0 | Δ 25.12→26.2 | Δ 26.2→26.3 |
|---|---|---|---|---|---|
| Besu | 0.761 | 0.441 | 0.431 | 🟢 −42% | 🟢 −2% |
| Erigon | 0.704 | 0.414 | 0.409 | 🟢 −41% | 🟢 −1% |
| Ethrex | 0.594 | 0.552 | 0.419 | 🟢 −7% | 🟢 −24% |
| Geth | 0.771 | 0.553 | 0.429 | 🟢 −28% | 🟢 −22% |
| Nethermind | 0.720 | 0.330 | 0.305 | 🟢 −54% | 🟢 −8% |
| Reth | 0.722 | 0.364 | 0.377 | 🟢 −50% | 🟠 +4% |
| Fleet Average | 0.712 | 0.442 | 0.395 | 🟢 −38% | 🟢 −11% |
CPU dropped 38% from 25.12.0 to 26.2.0. RocksDB's block cache and bloom filters reduce per-lookup processing compared to LevelDB. Version 26.3.0 added another 11% reduction through jemalloc's more efficient allocation patterns reducing GC-driven CPU spikes. The Nethermind pairing consistently shows the lowest Teku CPU usage across all three versions.
Memory & JVM analysis
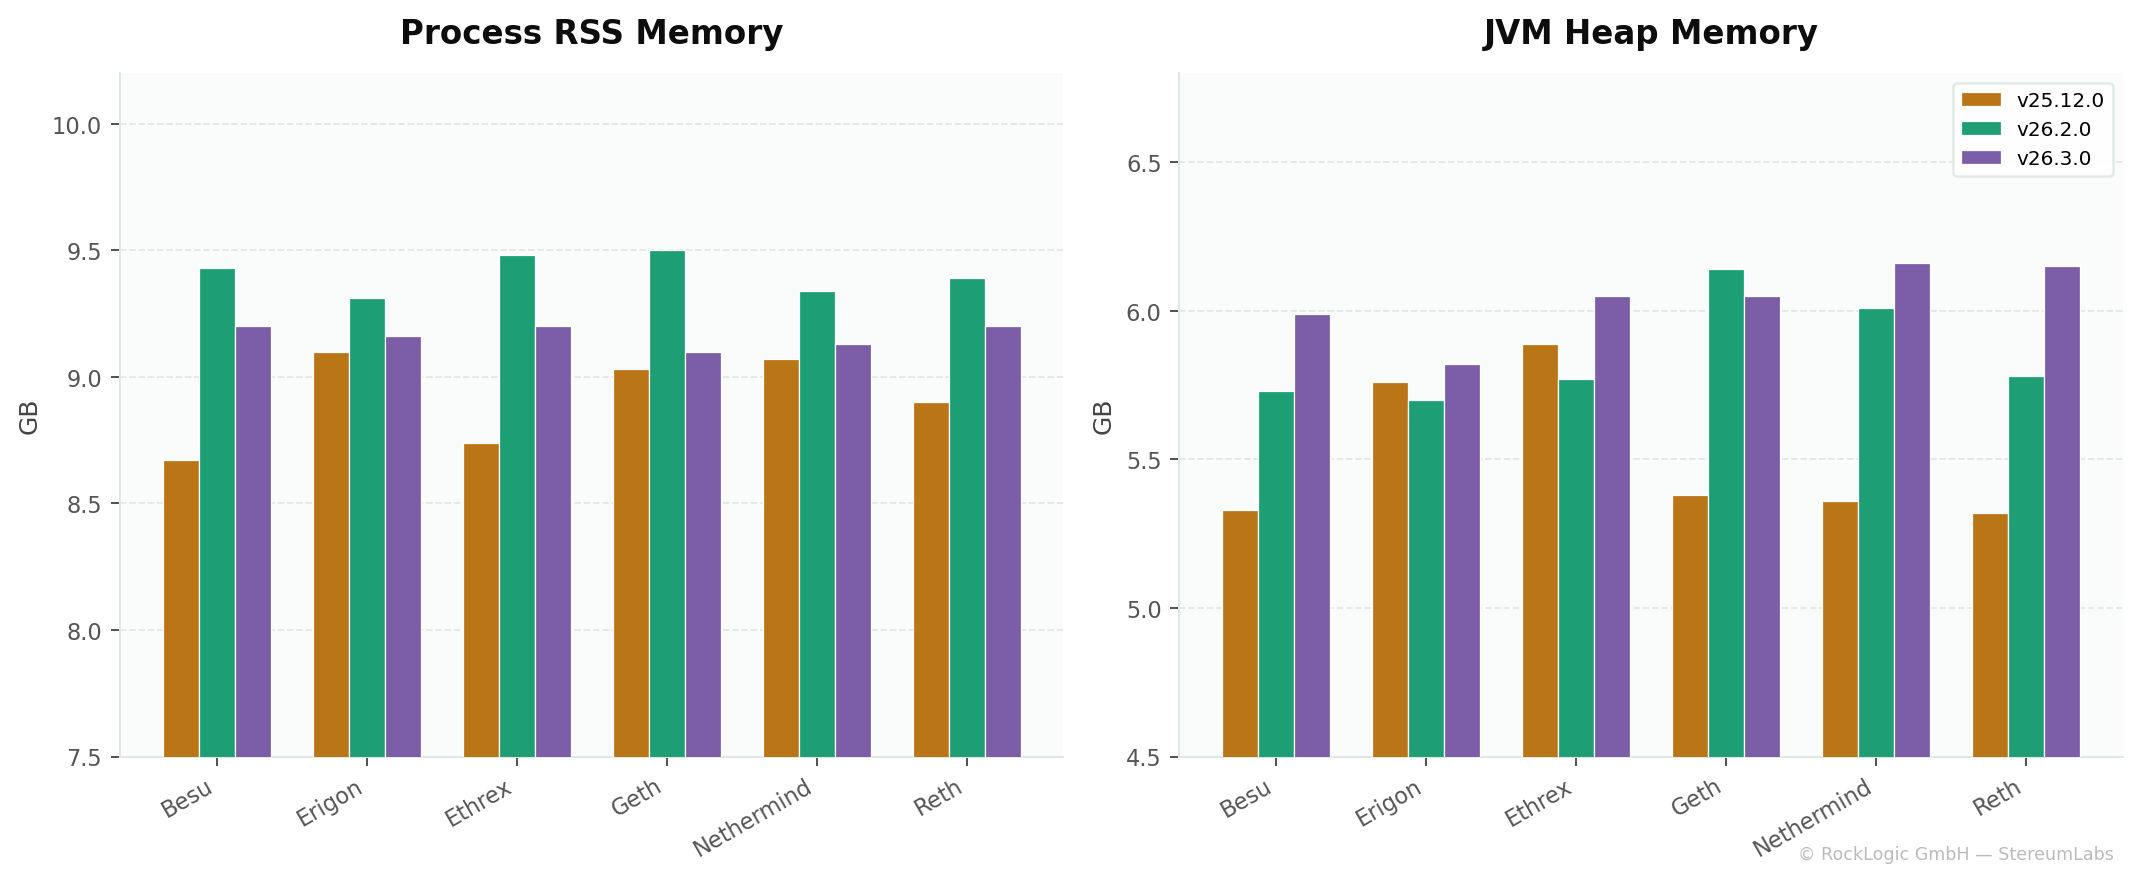
Process RSS memory
Metric: process_resident_memory_bytes{job="teku"} — total physical memory consumed by the Teku JVM process.
| EC Pairing | 25.12.0 (GB) | 26.2.0 (GB) | 26.3.0 (GB) | Δ 25.12→26.3 |
|---|---|---|---|---|
| Besu | 8.67 | 9.43 | 9.20 | 🟠 +6.2% |
| Erigon | 9.10 | 9.31 | 9.16 | ⚪ +0.6% |
| Ethrex | 8.74 | 9.48 | 9.20 | 🟠 +5.3% |
| Geth | 9.03 | 9.50 | 9.10 | ⚪ +0.7% |
| Nethermind | 9.07 | 9.34 | 9.13 | ⚪ +0.6% |
| Reth | 8.90 | 9.39 | 9.20 | 🟠 +3.4% |
| Fleet Average | 8.92 | 9.41 | 9.16 | 🟠 +2.8% |
RSS peaked in 26.2.0 (+5.5% vs 25.12.0), consistent with RocksDB's larger in-memory structures (block cache, memtables, bloom filters). Version 26.3.0 clawed back roughly half through jemalloc's reduced memory fragmentation, leaving a net +2.8%.
JVM heap memory
Metric: jvm_memory_used_bytes{area="heap"} — Java heap utilization.
| EC Pairing | 25.12.0 (GB) | 26.2.0 (GB) | 26.3.0 (GB) | Δ 25.12→26.3 |
|---|---|---|---|---|
| Besu | 5.33 | 5.73 | 5.99 | 🟠 +12.3% |
| Erigon | 5.76 | 5.70 | 5.82 | ⚪ +1.0% |
| Ethrex | 5.89 | 5.77 | 6.05 | 🟠 +2.7% |
| Geth | 5.38 | 6.14 | 6.05 | 🟠 +12.3% |
| Nethermind | 5.36 | 6.01 | 6.16 | 🟠 +15.0% |
| Reth | 5.32 | 5.78 | 6.15 | 🟠 +15.5% |
| Fleet Average | 5.51 | 5.85 | 6.04 | 🟠 +9.6% |
Heap grew steadily, reflecting increased in-heap state caching from the RocksDB JNI bridge and the natural growth of Ethereum's state tree. All values remain well within Teku's default 8 GB max heap.
JVM native memory
| Version | Fleet Avg (MB) | Delta |
|---|---|---|
| 25.12.0 | 705 | — |
| 26.2.0 | 739 | 🟠 +4.8% |
| 26.3.0 | 736 | ⚪ −0.4% |
Native (off-heap) memory rose modestly with RocksDB and stabilized with jemalloc.
JVM garbage collection
Metric: rate(jvm_gc_collection_seconds_sum[5m]) — fraction of time spent in GC per second. This is a critical Teku-specific metric because GC pauses directly impact block processing latency.
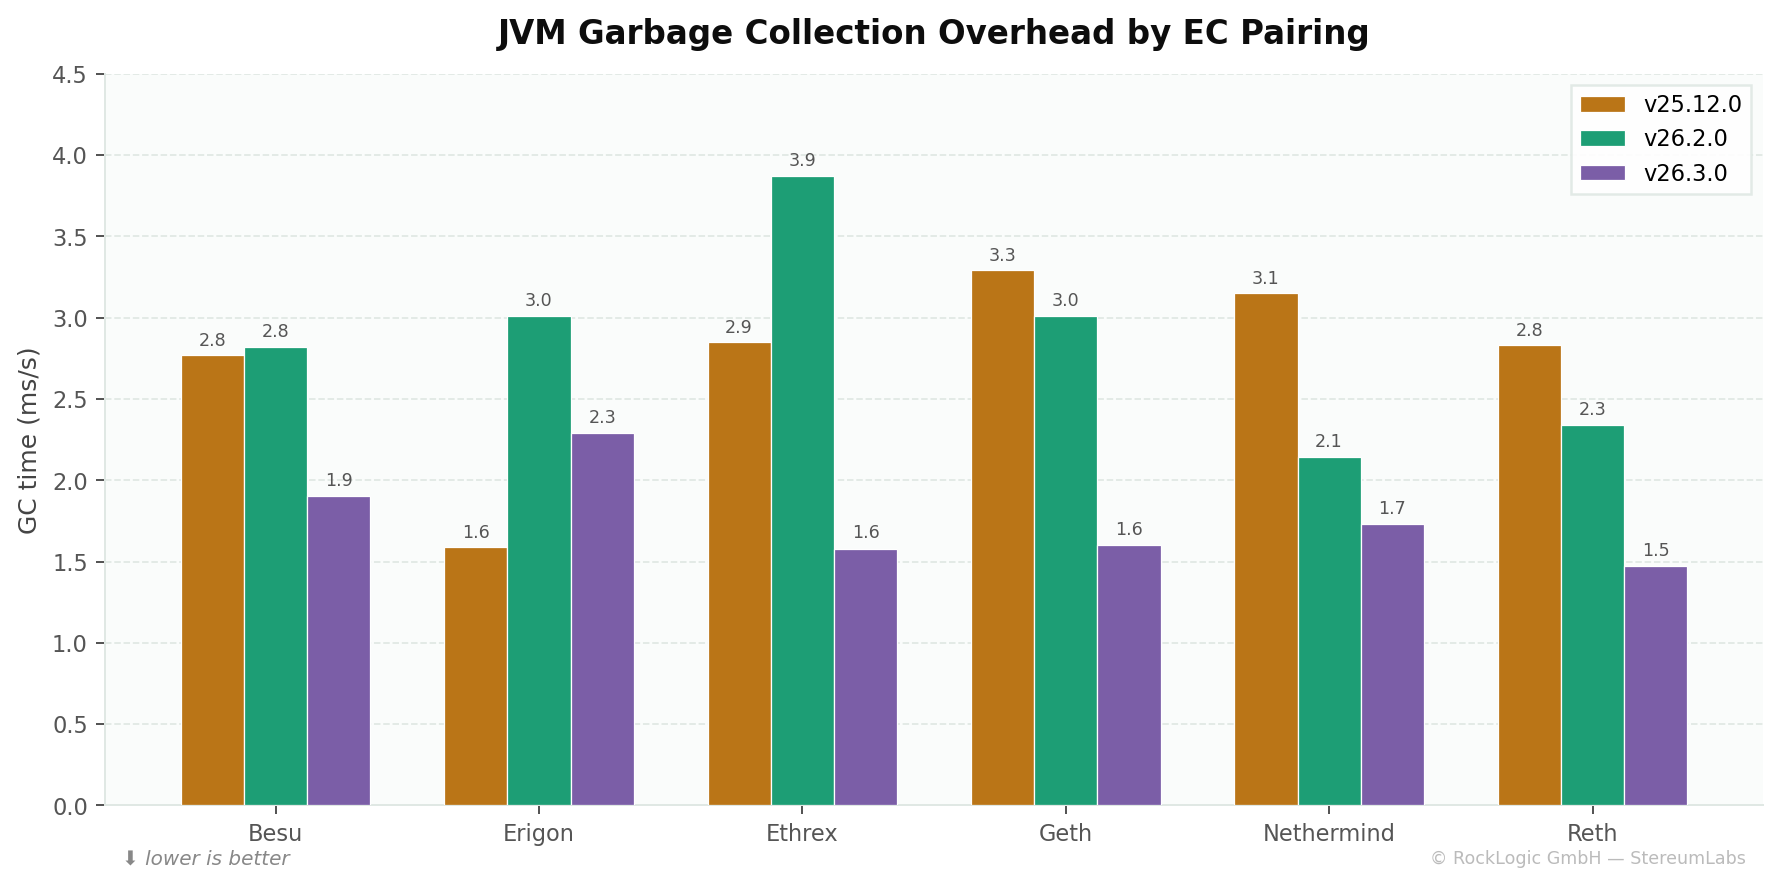
| EC Pairing | 25.12.0 (ms/s) | 26.2.0 (ms/s) | 26.3.0 (ms/s) | Δ 25.12→26.3 |
|---|---|---|---|---|
| Besu | 2.77 | 2.82 | 1.90 | 🟢 −31% |
| Erigon | 1.59 | 3.01 | 2.29 | 🔴 +44% |
| Ethrex | 2.85 | 3.87 | 1.58 | 🟢 −45% |
| Geth | 3.29 | 3.01 | 1.60 | 🟢 −51% |
| Nethermind | 3.15 | 2.14 | 1.73 | 🟢 −45% |
| Reth | 2.83 | 2.34 | 1.47 | 🟢 −48% |
| Fleet Average | 2.75 | 2.87 | 1.76 | 🟢 −36% |
GC overhead was flat from 25.12.0 to 26.2.0. The introduction of jemalloc in 26.3.0 is the standout: fleet-wide GC time dropped 36%. jemalloc reduces heap fragmentation, meaning fewer large-object promotions to old gen and fewer full GC cycles. For a Java client like Teku, this matters directly — GC pauses are a primary contributor to block import latency.
The Erigon pairing shows an anomalous GC increase across all versions. This may reflect interaction effects with Erigon's execution response patterns rather than a Teku-internal issue.
Storage engine & disk I/O
Host-level disk I/O
Metrics: rate(node_disk_read_bytes_total[5m]) and rate(node_disk_written_bytes_total[5m]) — host-level metrics that include both Teku CC and its paired EC. Since EC versions didn't change across measurement windows, deltas are attributable to the Teku version change.
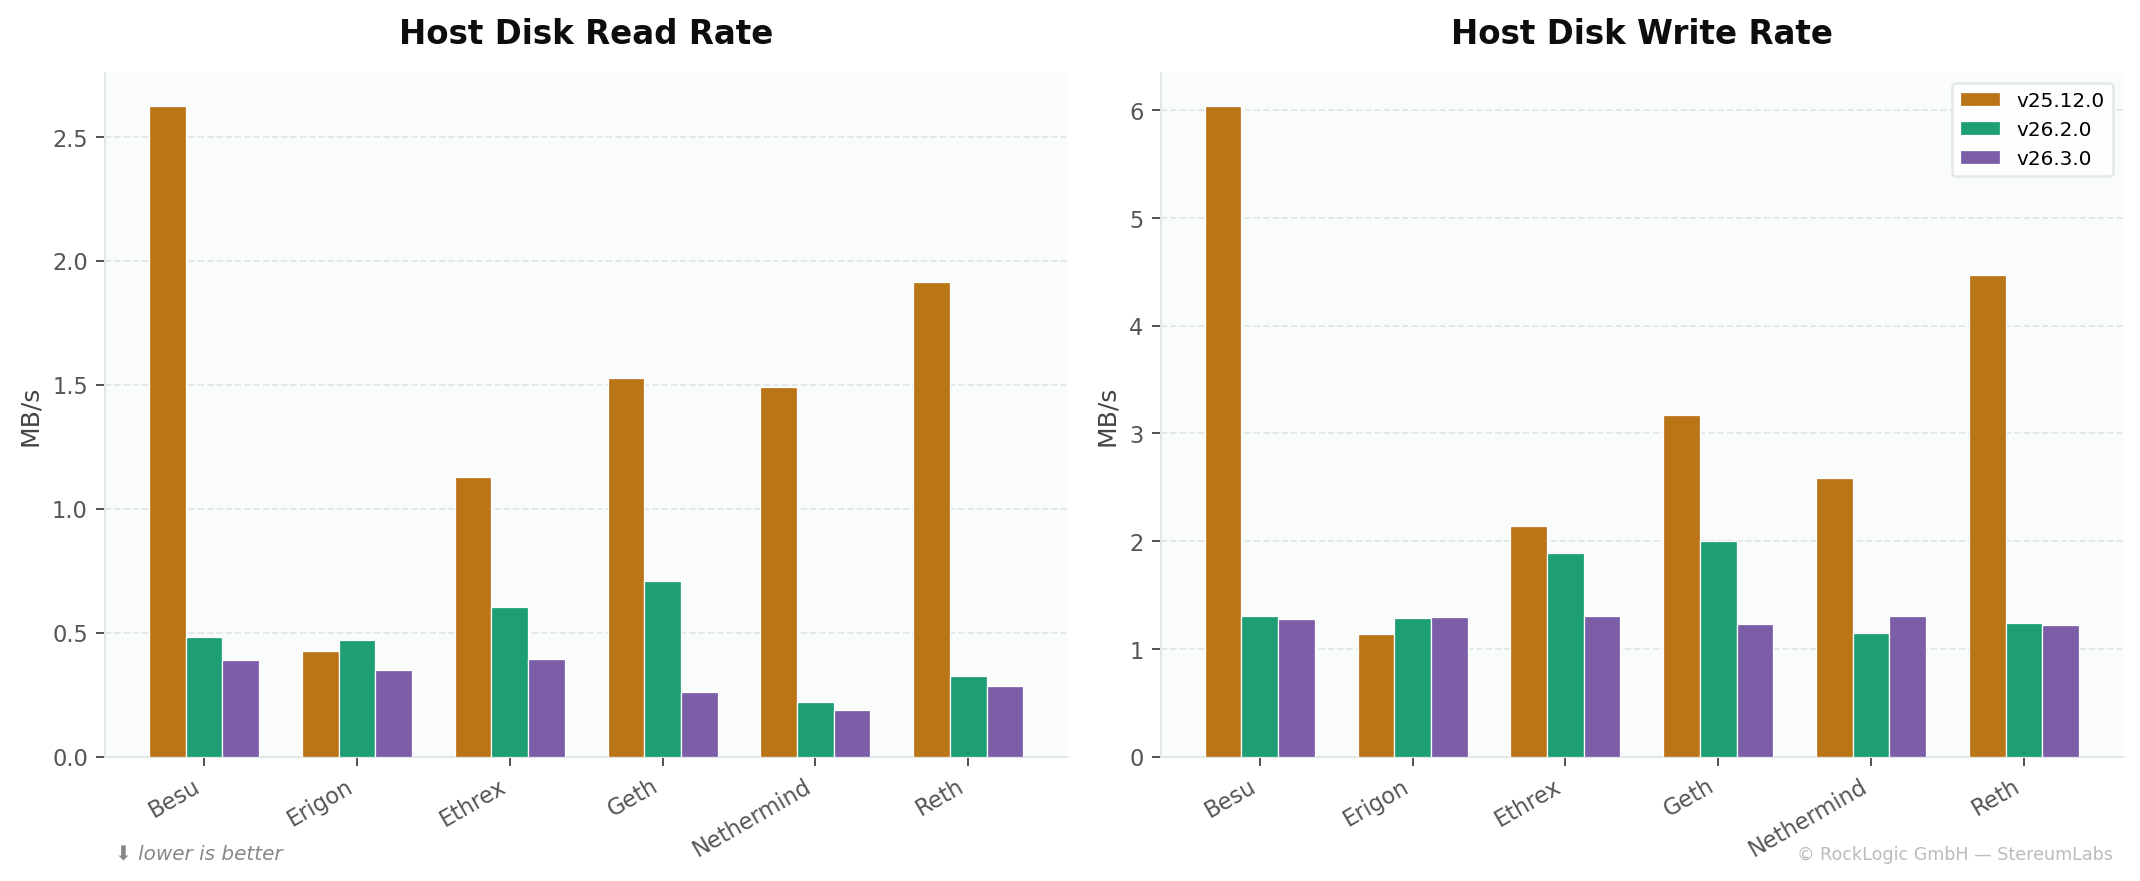
| EC Pairing | Read 25.12 | Read 26.2 | Read 26.3 | Write 25.12 | Write 26.2 | Write 26.3 |
|---|---|---|---|---|---|---|
| Besu | 2,625 | 483 | 390 | 6,040 | 1,305 | 1,272 |
| Erigon | 424 | 470 | 350 | 1,141 | 1,282 | 1,294 |
| Ethrex | 1,127 | 603 | 392 | 2,143 | 1,888 | 1,303 |
| Geth | 1,528 | 710 | 259 | 3,172 | 2,003 | 1,227 |
| Nethermind | 1,489 | 220 | 186 | 2,583 | 1,145 | 1,304 |
| Reth | 1,916 | 326 | 283 | 4,468 | 1,243 | 1,220 |
| Fleet Avg | 1,518 | 469 | 310 | 3,258 | 1,478 | 1,270 |
All values in KB/s.
Read throughput dropped 79% (1,518 → 310 KB/s) and write throughput fell 61% (3,258 → 1,270 KB/s). RocksDB's block cache and SST-based design is far more read-efficient than LevelDB. The Besu pairing saw the most dramatic read improvement (−85%).
RocksDB internal metrics (26.2.0+ only)
These metrics are only available for versions using RocksDB. Version 25.12.0 ran LevelDB which does not expose equivalent counters.
| Metric | 26.2.0 Fleet Avg | 26.3.0 Fleet Avg | Delta |
|---|---|---|---|
storage_bytes_read rate (KB/s) | 84.3 | 103.6 | 🟠 +23% |
storage_bytes_written rate (MB/s) | 1.53 | 1.35 | 🟢 −12% |
storage_compact_write_bytes rate (KB/s) | 543.5 | 484.0 | 🟢 −11% |
Write amplification improved in 26.3.0: both raw write rate and compaction writes decreased ~11%. The slight read increase likely reflects the partial sidecar import feature doing more background reads.
Block import performance
Metric: beacon_block_import_delay_latest — most recent block import delay in milliseconds. This captures end-to-end latency from receiving a block to completing its import into the beacon state.
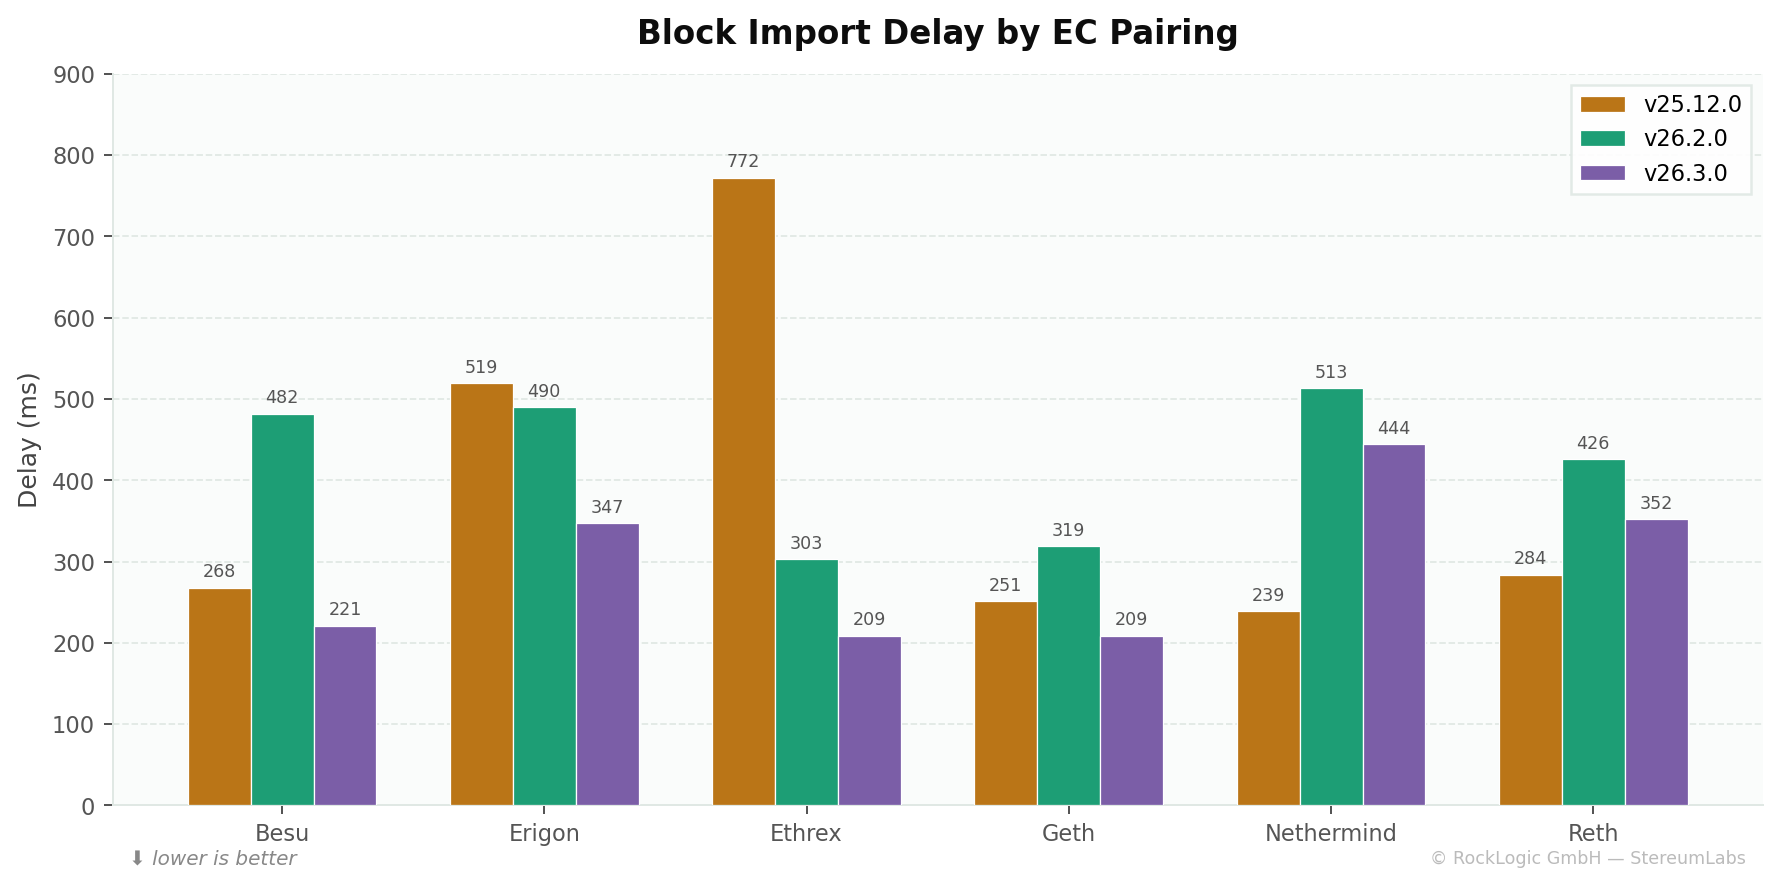
| EC Pairing | 25.12.0 (ms) | 26.2.0 (ms) | 26.3.0 (ms) | Δ 25.12→26.3 |
|---|---|---|---|---|
| Besu | 268 | 482 | 221 | 🟢 −18% |
| Erigon | 519 | 490 | 347 | 🟢 −33% |
| Ethrex | 772 | 303 | 209 | 🟢 −73% |
| Geth | 251 | 319 | 209 | 🟢 −17% |
| Nethermind | 239 | 513 | 444 | 🔴 +86% |
| Reth | 284 | 426 | 352 | 🔴 +24% |
| Fleet Average | 389 | 422 | 297 | 🟢 −24% |
Version 26.2.0 was slightly slower fleet-wide — likely early-stage RocksDB tuning and the concurrent DAS backfiller adding load. Version 26.3.0 brought a strong recovery, achieving the lowest fleet-wide latency at 297 ms. The Ethrex pairing improved most dramatically (−73%), while the Nethermind pairing shows persistently elevated import times that warrant EC-side investigation.
Lower block import delay means attestations can be created sooner after a block arrives, directly improving validator effectiveness and reducing inclusion delay.
P2P networking & peer connectivity
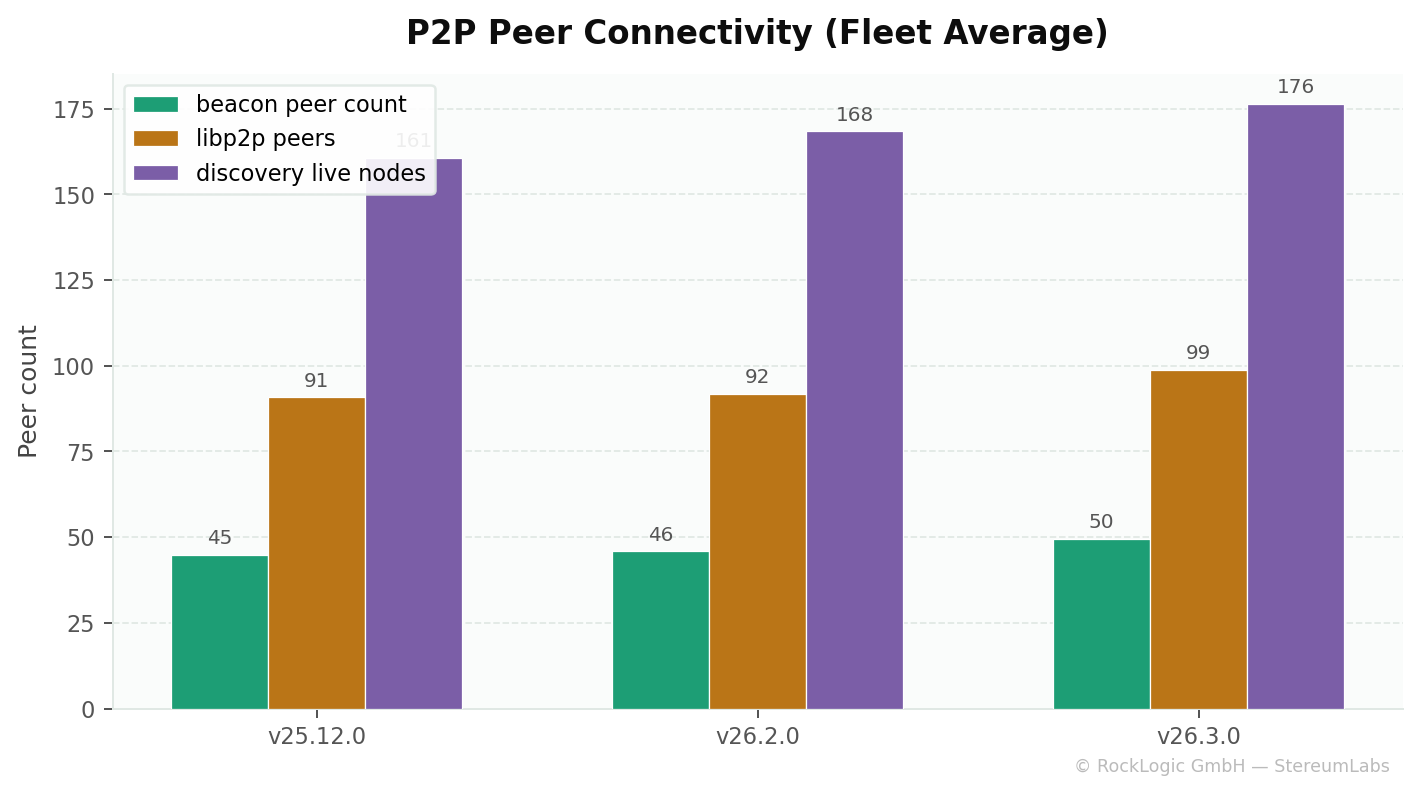
| Metric | 25.12.0 | 26.2.0 | 26.3.0 | Trend |
|---|---|---|---|---|
beacon_peer_count (fleet avg) | 44.9 | 45.9 | 49.5 | 🟢 +10% |
libp2p_peers (fleet avg) | 90.8 | 91.9 | 98.9 | 🟢 +9% |
discovery_live_nodes (fleet avg) | 160.7 | 168.4 | 176.4 | 🟢 +10% |
| Gossip rate (msg/s, fleet avg) | 6.23 | 5.99 | 7.85 | 🟢 +26% |
All peer metrics improved steadily. Discovery live nodes grew from ~161 to ~176, suggesting the Discv5 layer is maintaining more active ENR records. Gossip throughput peaked in 26.3.0 — consistent with faster block processing enabling quicker re-gossip.
Data availability sampling (DAS) & PeerDAS
Metric: rate(beacon_data_column_sidecar_processing_requests_total[5m]) — DAS workload rate.
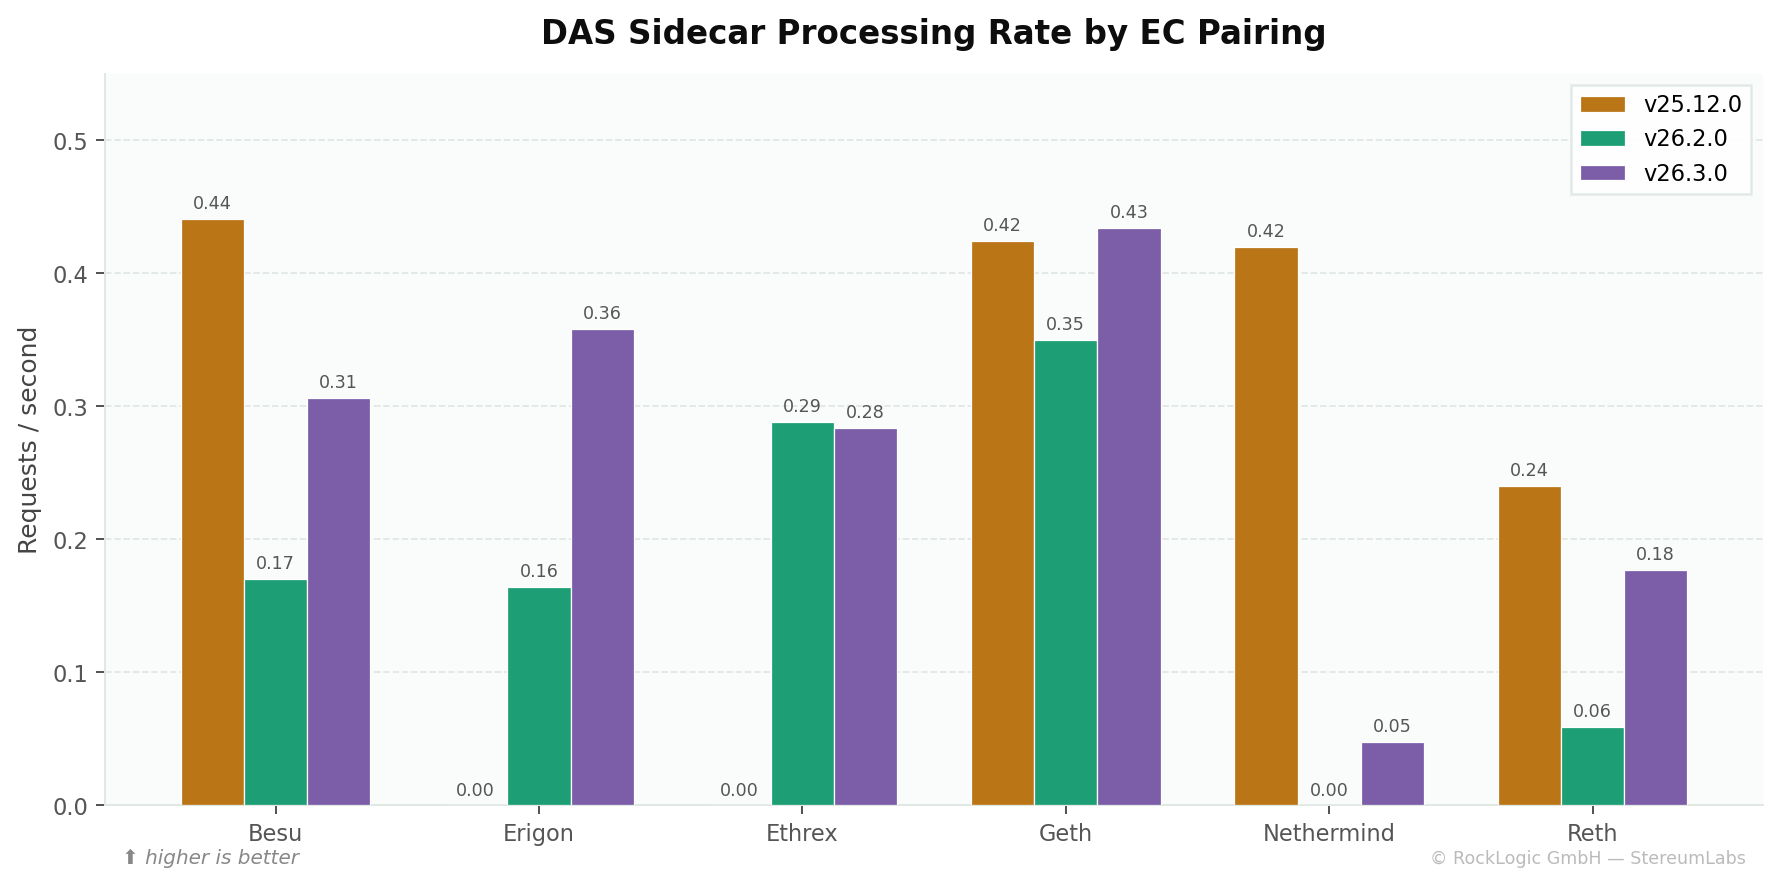
DAS processing rates show significant per-pairing variance. The zero values in 25.12.0 for Erigon/Ethrex reflect sync issues that resolved in later versions. Version 26.3.0 allows nodes with >50% custody requirements to begin importing blocks after downloading only 50% of sidecars — an architectural improvement that doesn't compromise data availability guarantees.
Open file descriptors — the trade-off
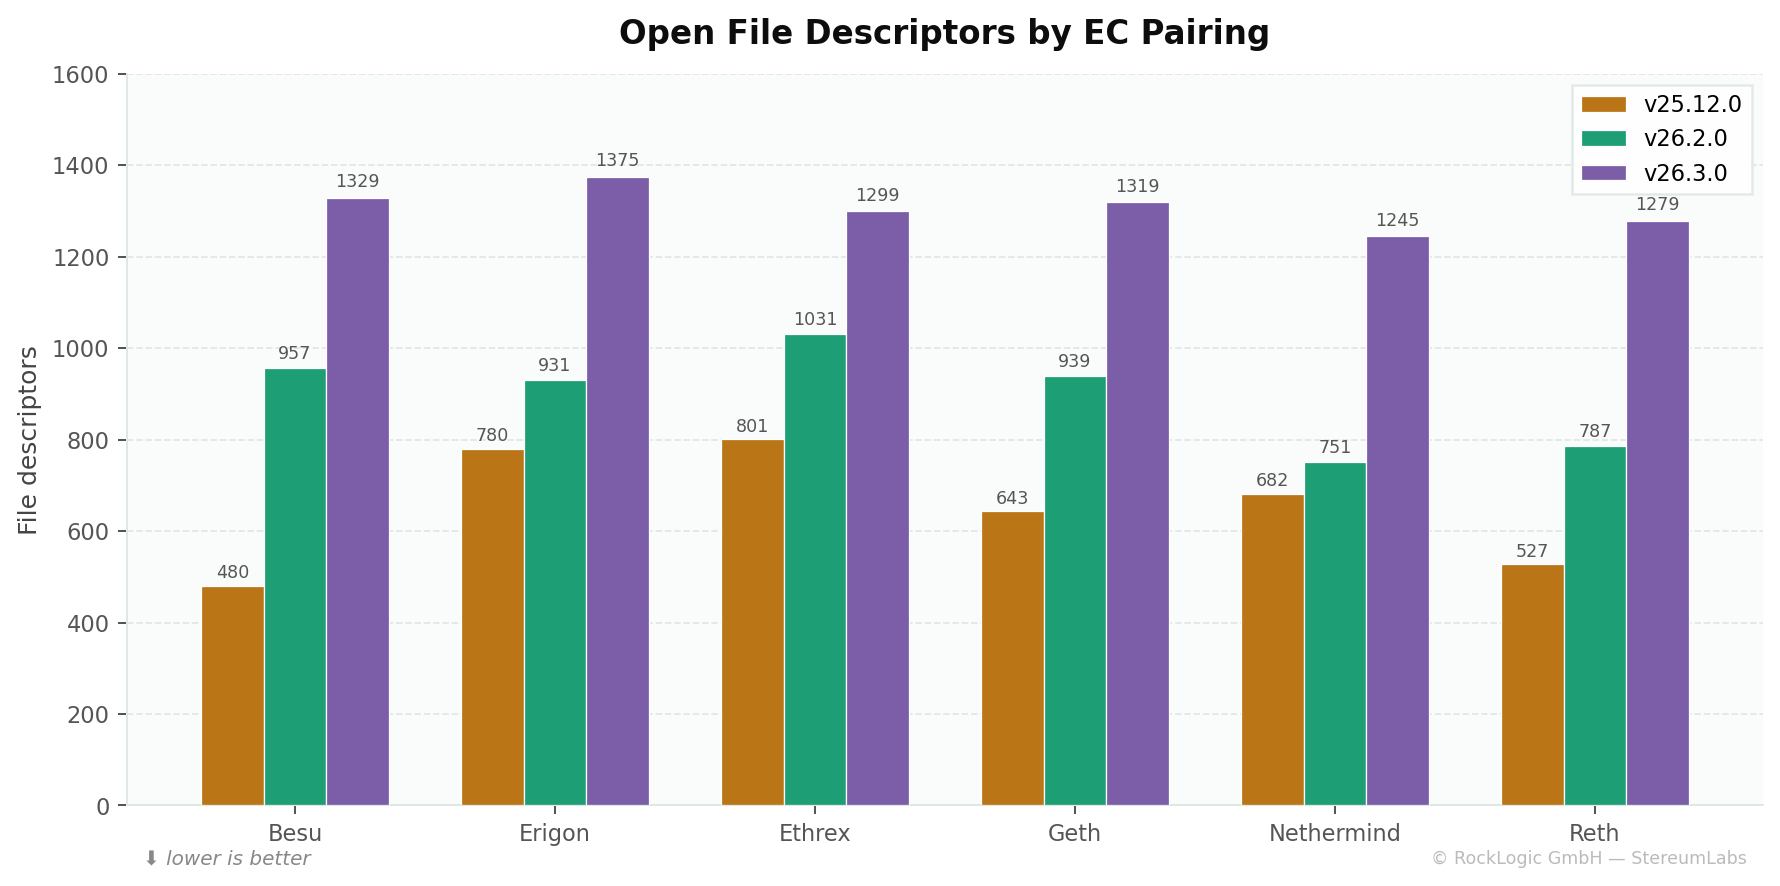
| EC Pairing | 25.12.0 | 26.2.0 | 26.3.0 | Δ 25.12→26.3 |
|---|---|---|---|---|
| Besu | 480 | 957 | 1,329 | 🔴 +177% |
| Erigon | 780 | 931 | 1,375 | 🔴 +76% |
| Ethrex | 801 | 1,031 | 1,299 | 🔴 +62% |
| Geth | 643 | 939 | 1,319 | 🔴 +105% |
| Nethermind | 682 | 751 | 1,245 | 🔴 +83% |
| Reth | 527 | 787 | 1,279 | 🔴 +143% |
| Fleet Average | 652 | 899 | 1,308 | 🔴 +101% |
File descriptors doubled — the most visible trade-off of RocksDB. Its LSM-tree architecture holds many SST files open simultaneously for efficient reads. Growth continued from 26.2.0 to 26.3.0 as databases accumulated more SST files through compaction.
Ensure ulimit -n is set to at least 65536 on hosts running Teku 26.x. The default 1024 on many Linux distributions will cause failures. Docker containers should pass --ulimit nofile=65536:65536.
Summary & recommendations
| Dimension | 25.12.0 | 26.2.0 | 26.3.0 |
|---|---|---|---|
| CPU Efficiency | Baseline | 🟢 Major improvement | 🟢 Best |
| Memory Footprint | 🟢 Lowest | 🟠 +5.5% | 🟠 +2.8% (recovering) |
| GC Overhead | Baseline | ⚪ Similar | 🟢 Best (−36%) |
| Disk I/O | 🔴 Highest | 🟢 Major improvement | 🟢 Best |
| Block Import Speed | Moderate | 🟠 Slight regression | 🟢 Best (297ms) |
| Peer Connectivity | Good | Good | 🟢 Best |
| File Descriptors | 🟢 Lowest | 🟠 +38% | 🔴 +101% (monitor) |
| Storage Backend | LevelDB | RocksDB | RocksDB + jemalloc |
| Stability | 🟢 Stable | 🟢 Stable | 🟢 Mandatory (SSZ fix) |
Key takeaways
-
Upgrade to 26.3.0 is mandatory. Beyond the SSZ serialization bug fix, 26.3.0 delivers the best performance profile across nearly every dimension.
-
Verify file descriptor limits. With 26.3.0 averaging 1,308 open FDs (and likely higher under peak load), ensure systems allow at least 65,536 file descriptors.
-
Monitor RocksDB compaction. Add
storage_compact_write_bytesandstorage_bytes_writtento your dashboards. Abnormal compaction spikes can indicate database health issues. -
Consider DAS backfiller tuning. If 26.x nodes show elevated CPU during backfill,
--Xp2p-reworked-sidecar-custody-sync-batch-size=1can throttle the backfiller. -
Watch the Nethermind pairing. Block import delays are persistently higher with Nethermind across 26.x versions — this warrants investigation on the EL side.
Download the full report
The complete analysis with additional detail on JVM thread pools, executor queue depths, and RocksDB internal counters is available as a styled PDF:
Methodology notes
All data sourced from the prometheus-cold datasource (Org 6) in the StereumLabs Grafana instance. Query pattern: avg by (ec_client) (avg_over_time(metric{cc_client="teku", cc_version="...", role="cc", job="teku"}[14d:1h])) evaluated as instant queries at the end of each 14-day window. Rate metrics use rate(...[5m]) inside the subquery. Host-level metrics filtered with device!~"lo|veth.*|docker.*|br.*" to exclude virtual interfaces. All nodes run on NDC2 bare-metal (Vienna), eliminating cloud noise.
For details on our label conventions and how to build your own dashboards against our data, see Build your own dashboards.