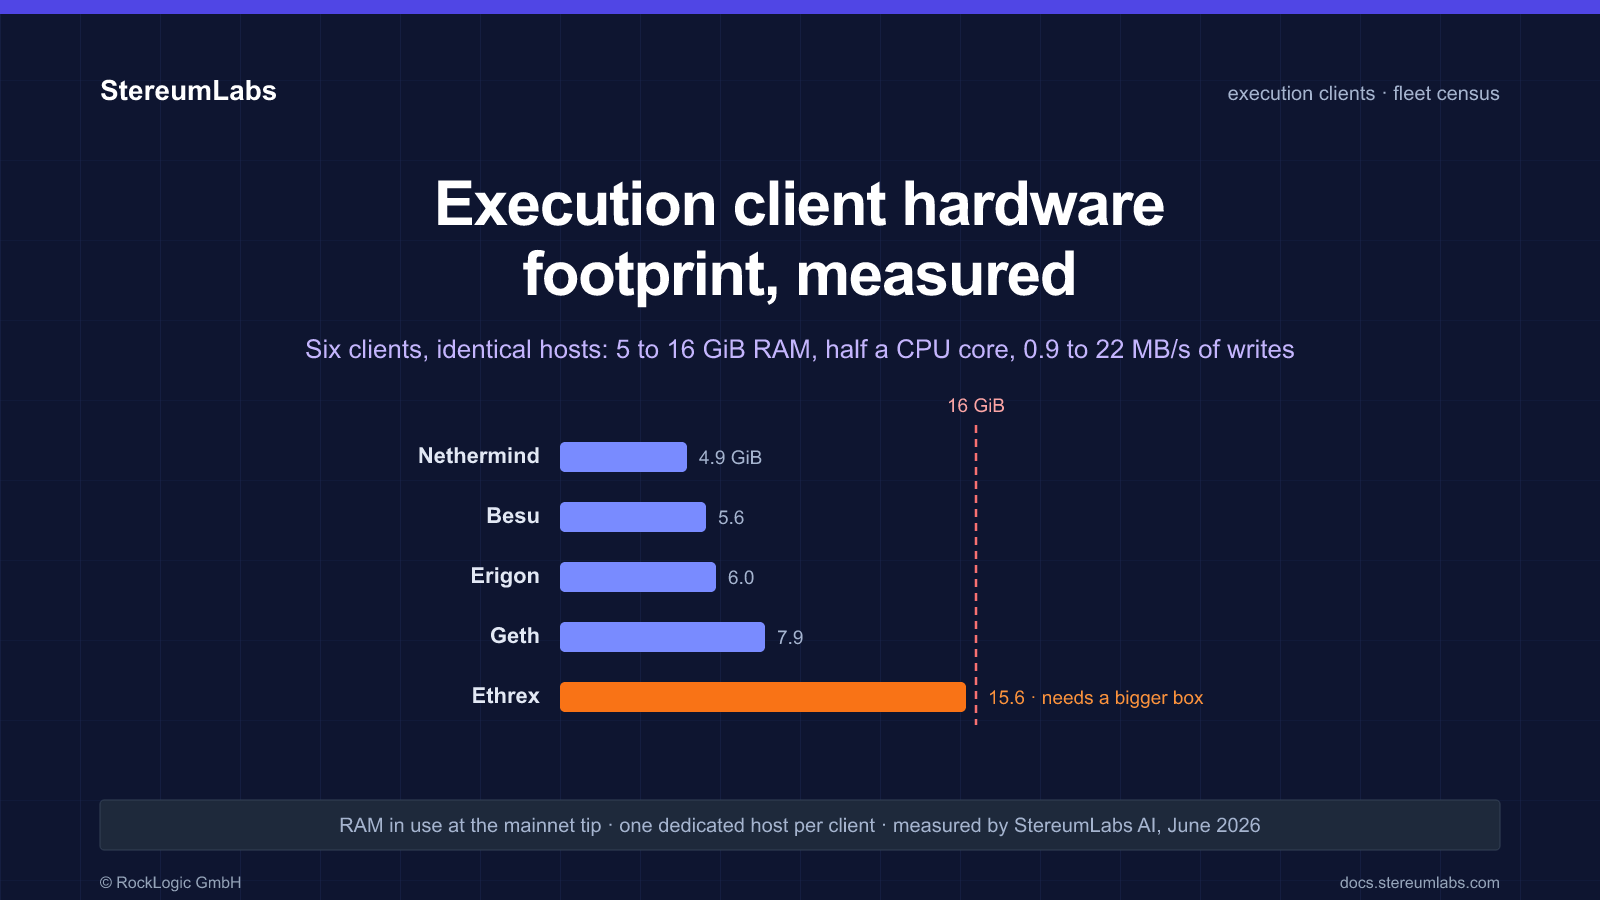
Ethereum execution client hardware footprint, measured
Six execution clients on identical hosts: 5 to 16 GiB RAM, half a CPU core at the tip, and disk writes from 0.9 to 22 MB/s. What each client costs to run, and why one needs a bigger box.
Independent Ethereum client measurements
Neutral, hardware-backed measurements of Ethereum execution and consensus clients.
Operated by RockLogic GmbH · ISO 27001 certified · Supported by an Ethereum Foundation grant
From the blog
A few hand-picked posts from our blog.
Six execution clients on identical hosts: 5 to 16 GiB RAM, half a CPU core at the tip, and disk writes from 0.9 to 22 MB/s. What each client costs to run, and why one needs a bigger box.
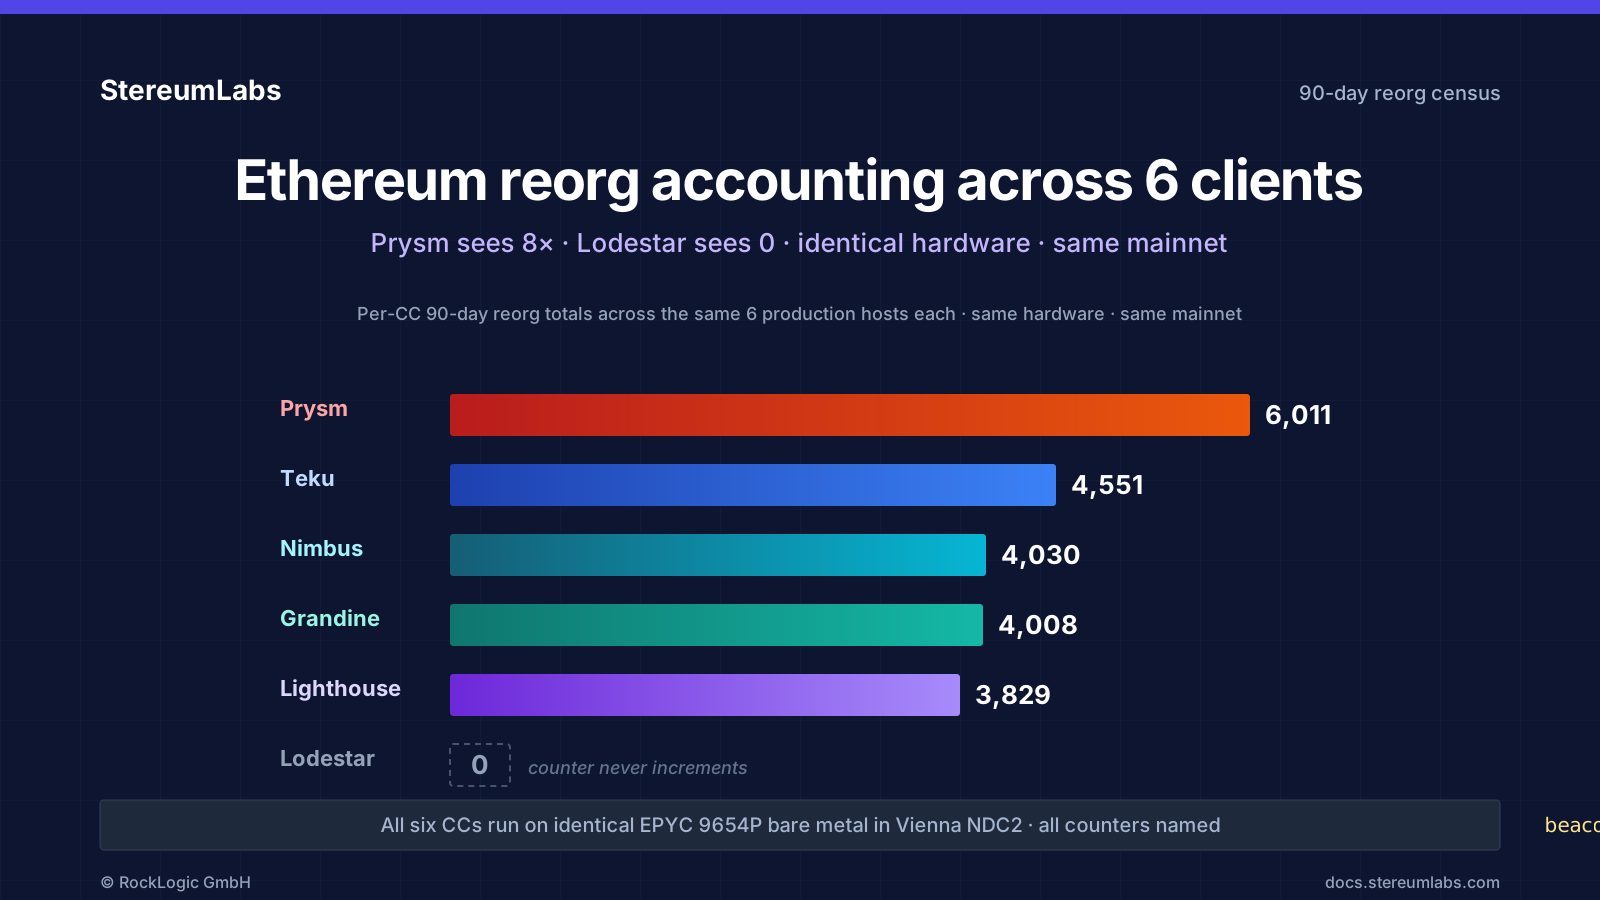
The same six Ethereum consensus clients on identical hardware reported between 0 and 5,791 reorgs over 90 days. Why their counters disagree, and what it means for your alerts.
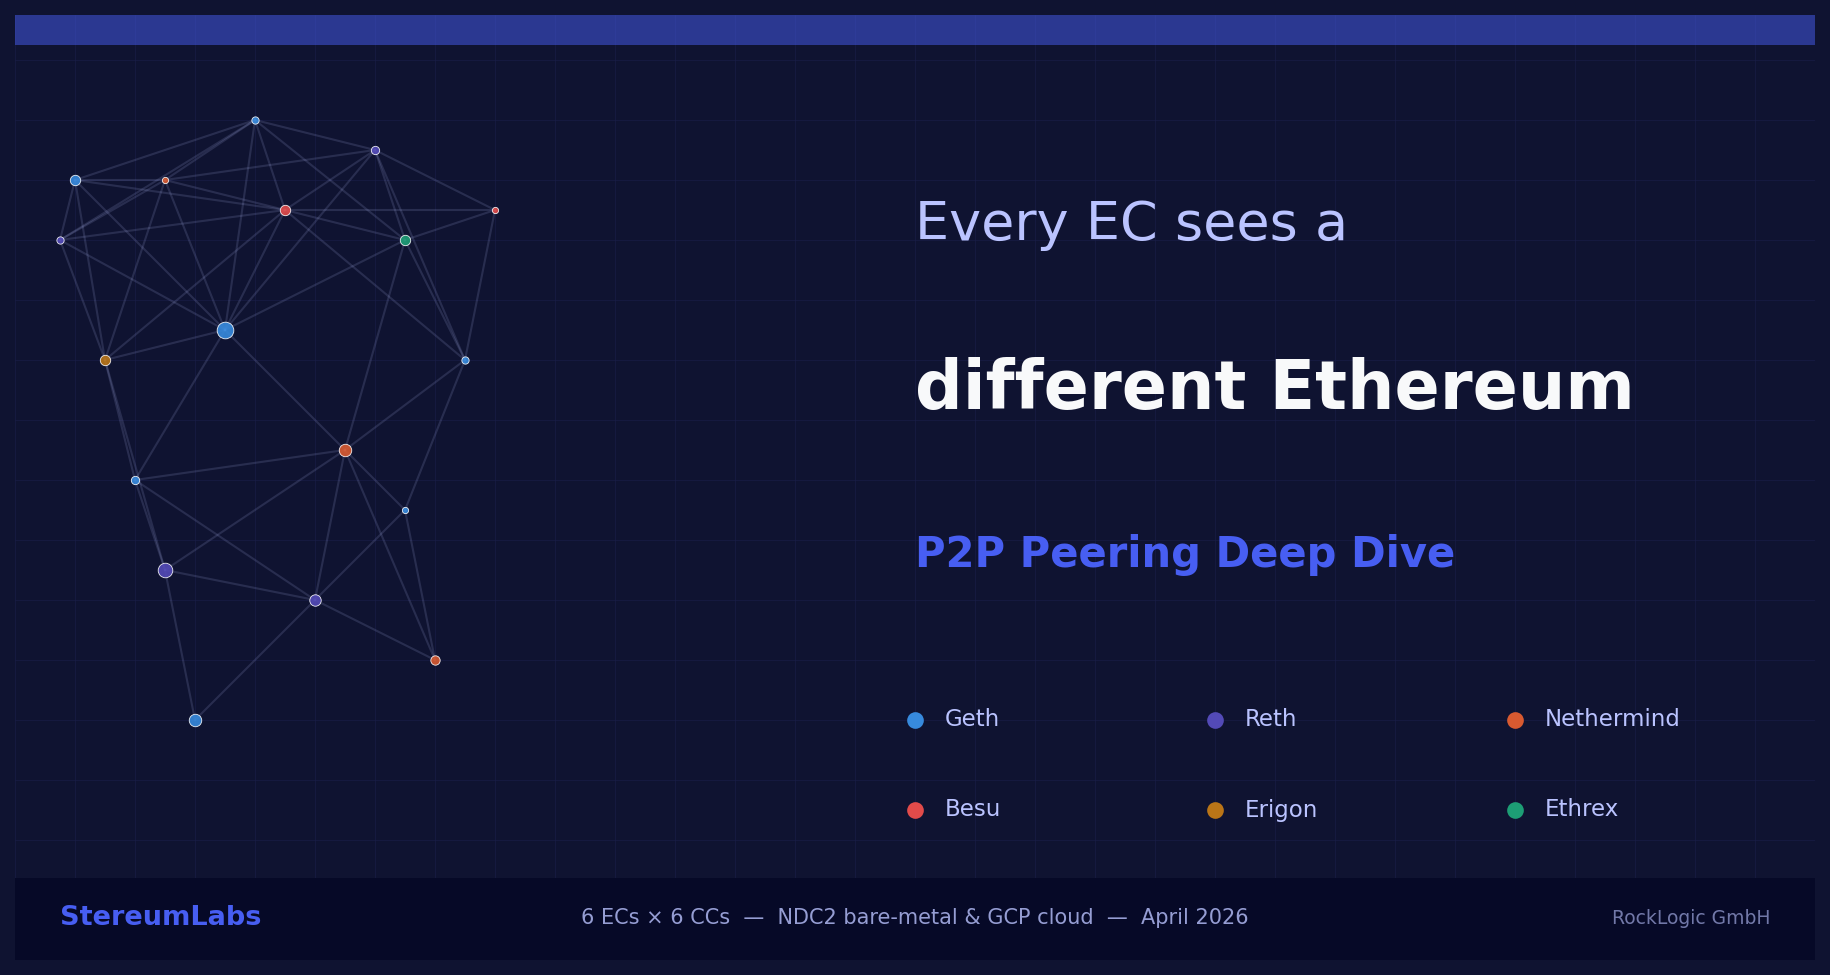
Every EC connects to different peers, churns at different rates, and sees a different slice of the network. From 25 to 130 peers, with one common cloud misconfig that quietly degrades 70% of connections.
Series
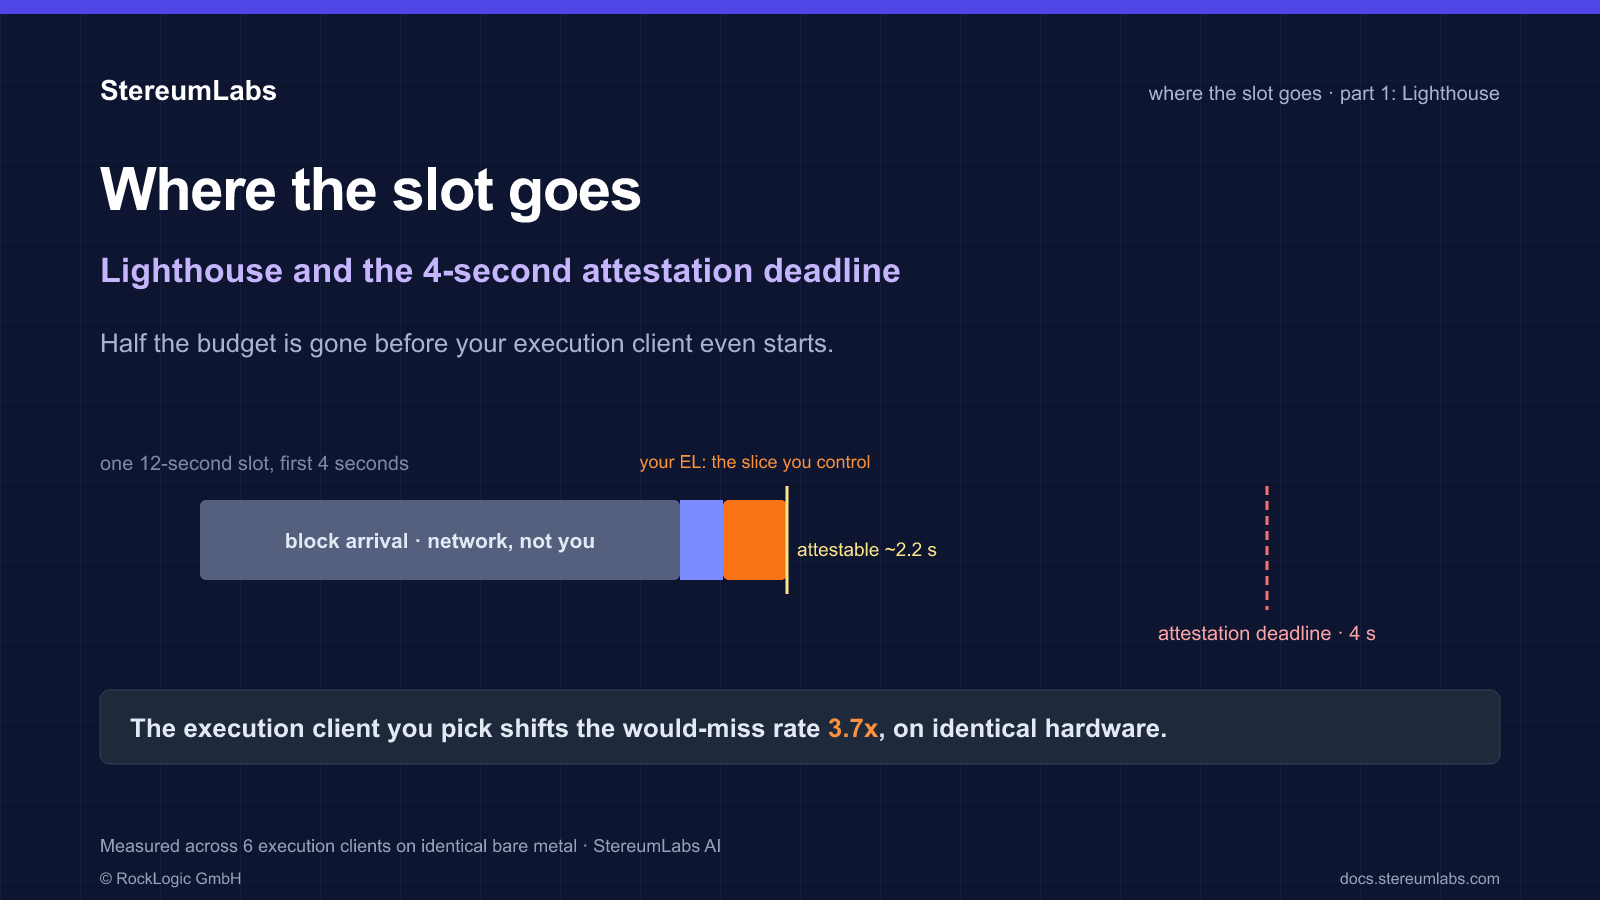
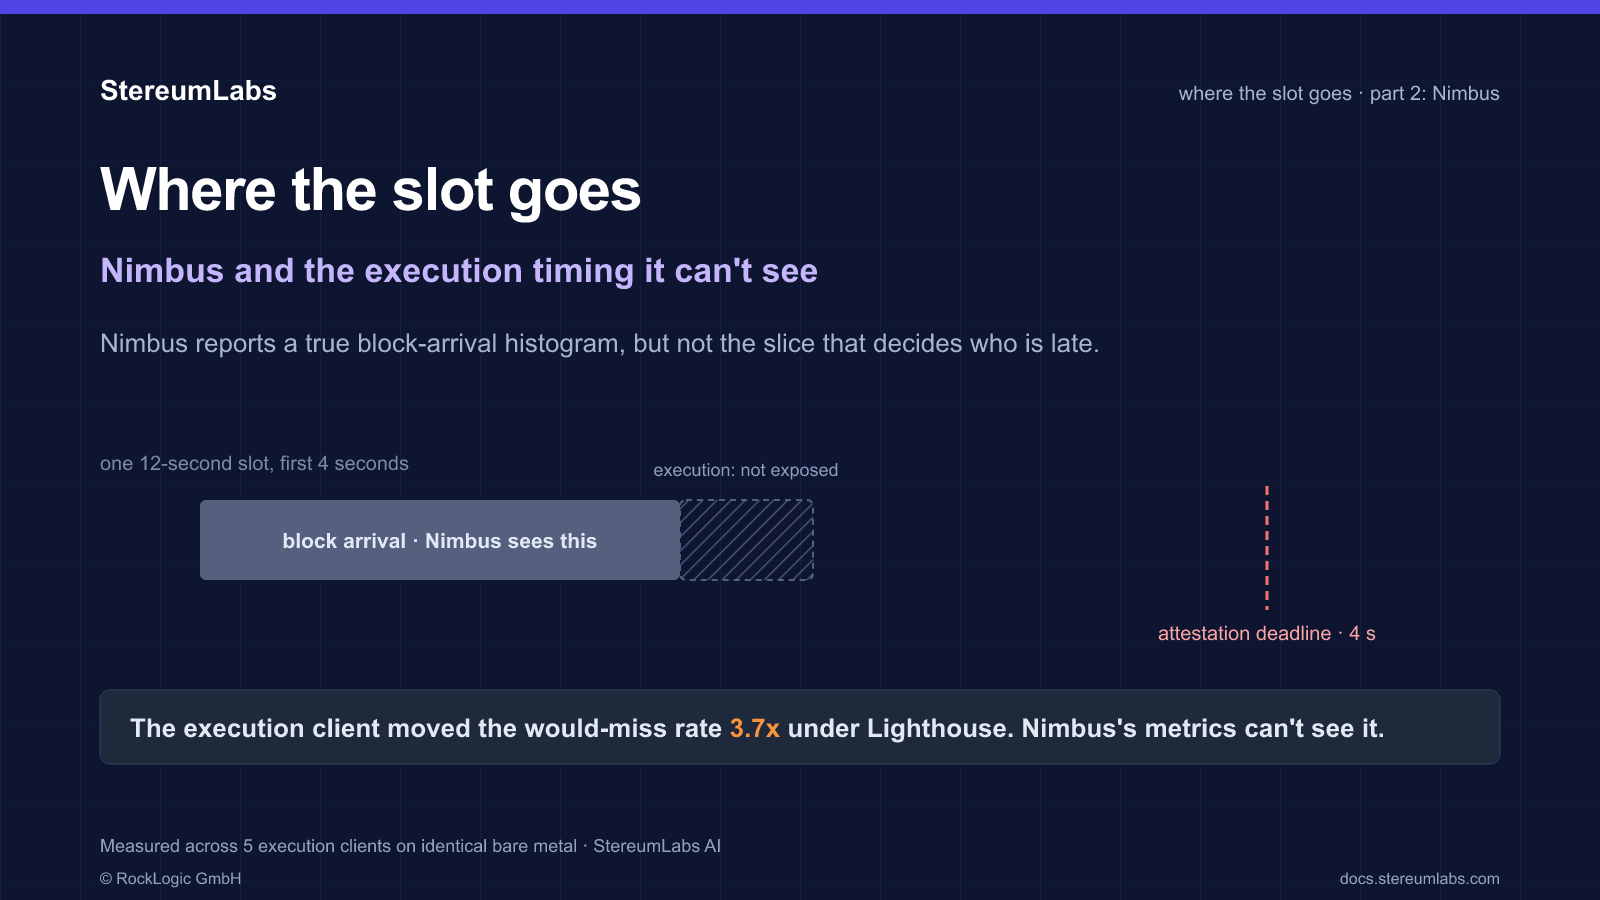
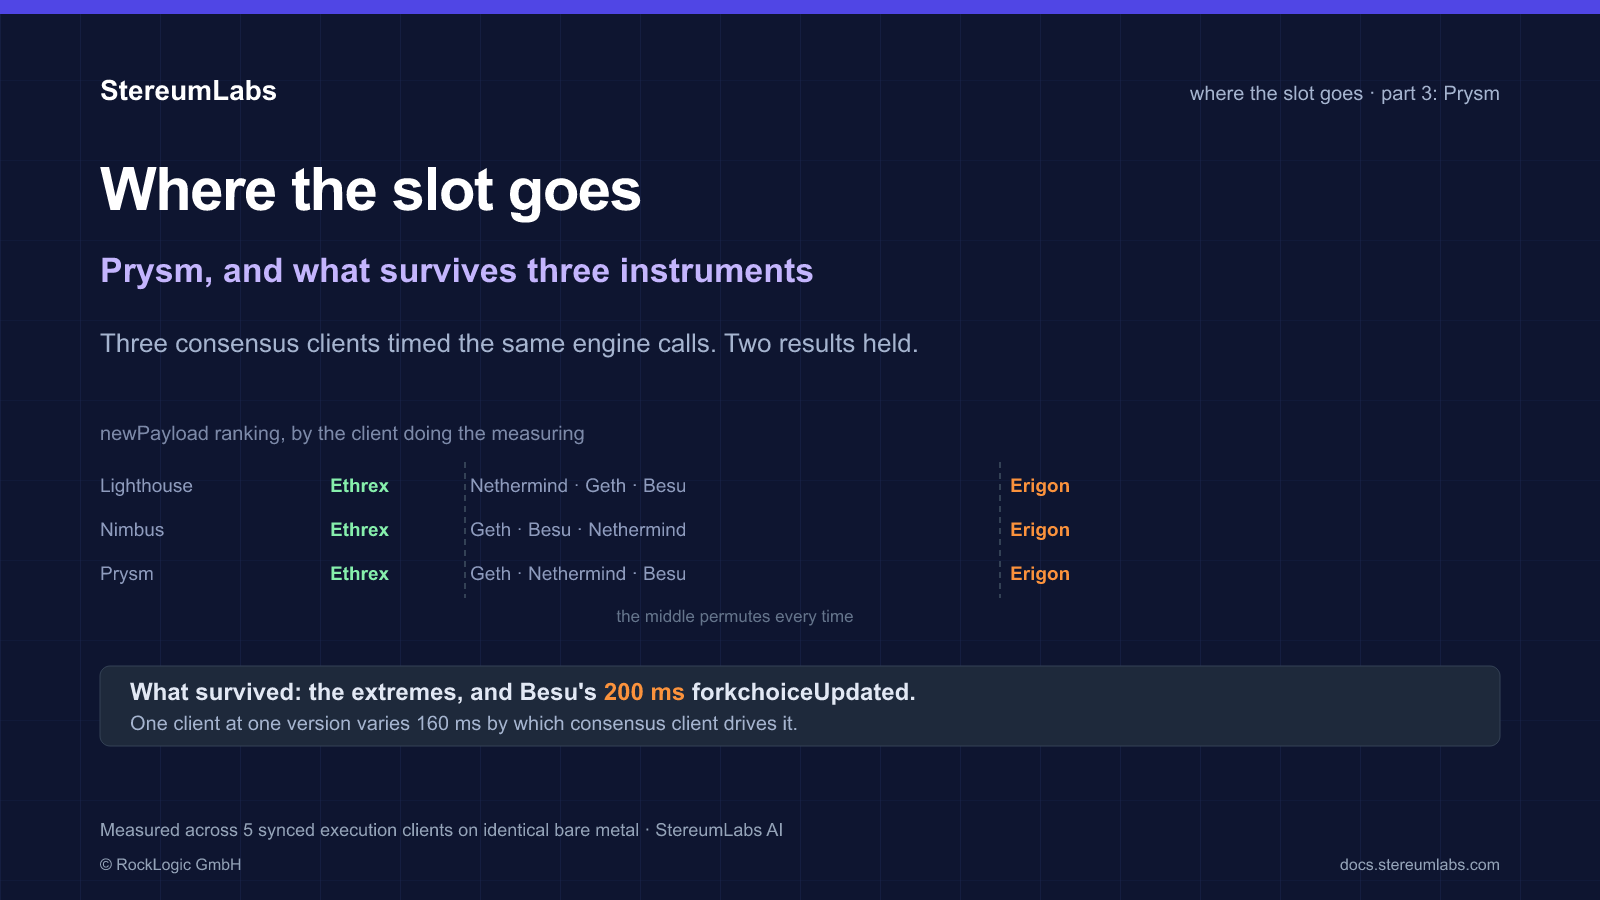
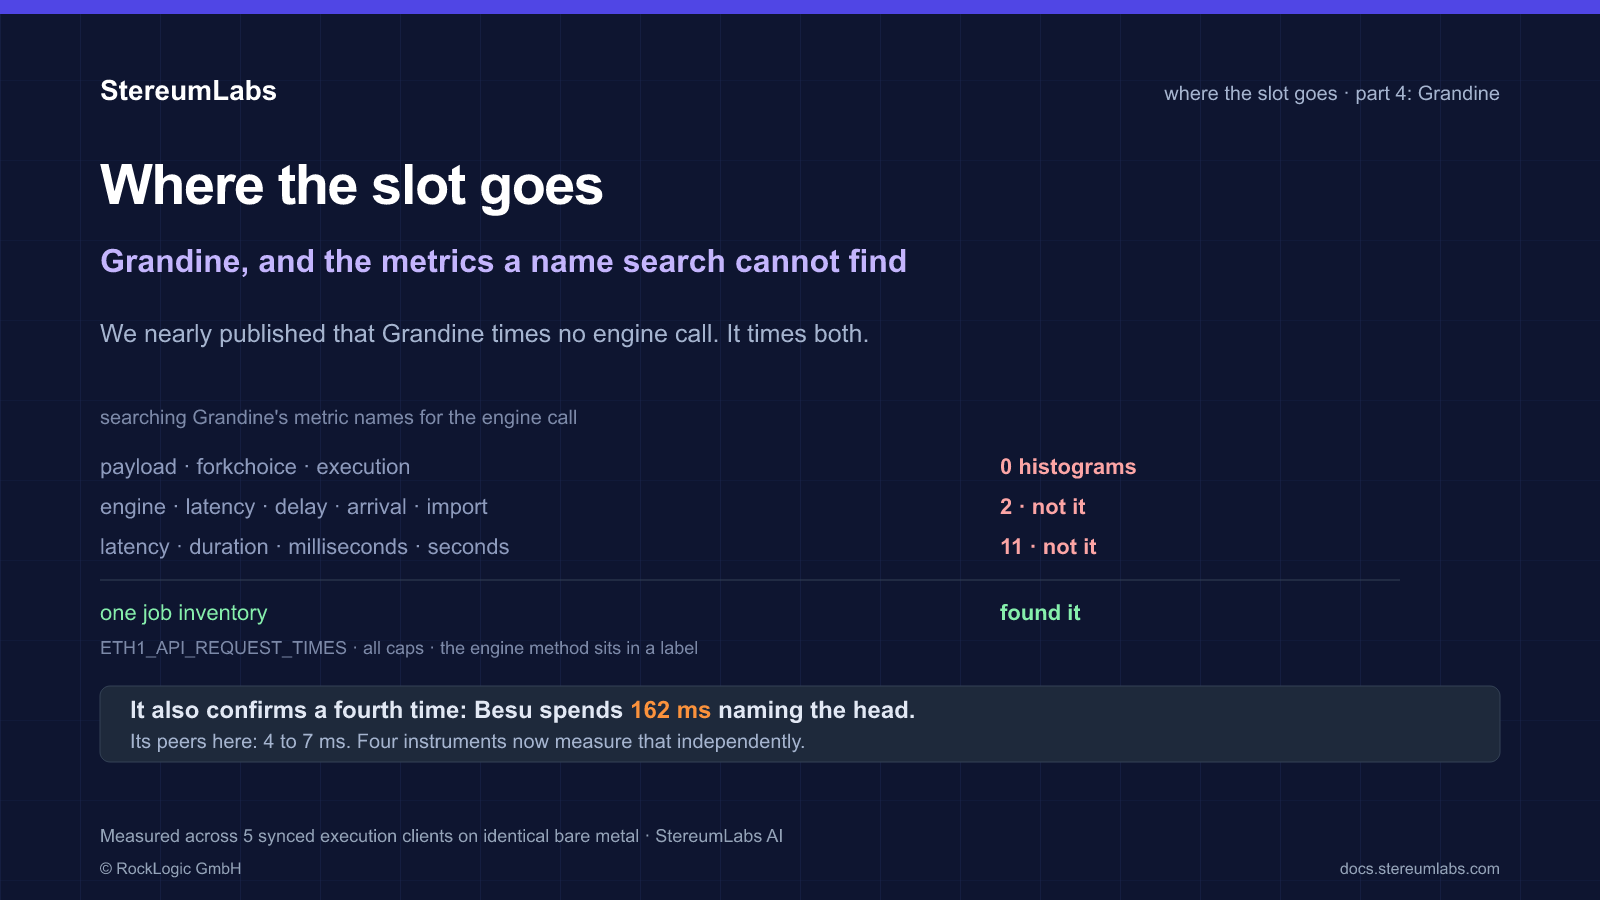
One consensus client at a time: where a 12-second slot goes against the 4-second attestation deadline, and how each client lets you see it.
Half the 4-second budget is gone before your execution client even starts. Under Lighthouse, the EC you pick shifts the would-fail-attestation rate up to 3.7x on identical hardware.
Nimbus reports a complete block-arrival histogram but no execution timing, so its own metrics cannot rank execution clients the way Lighthouse can. What you can and cannot diagnose per consensus client.
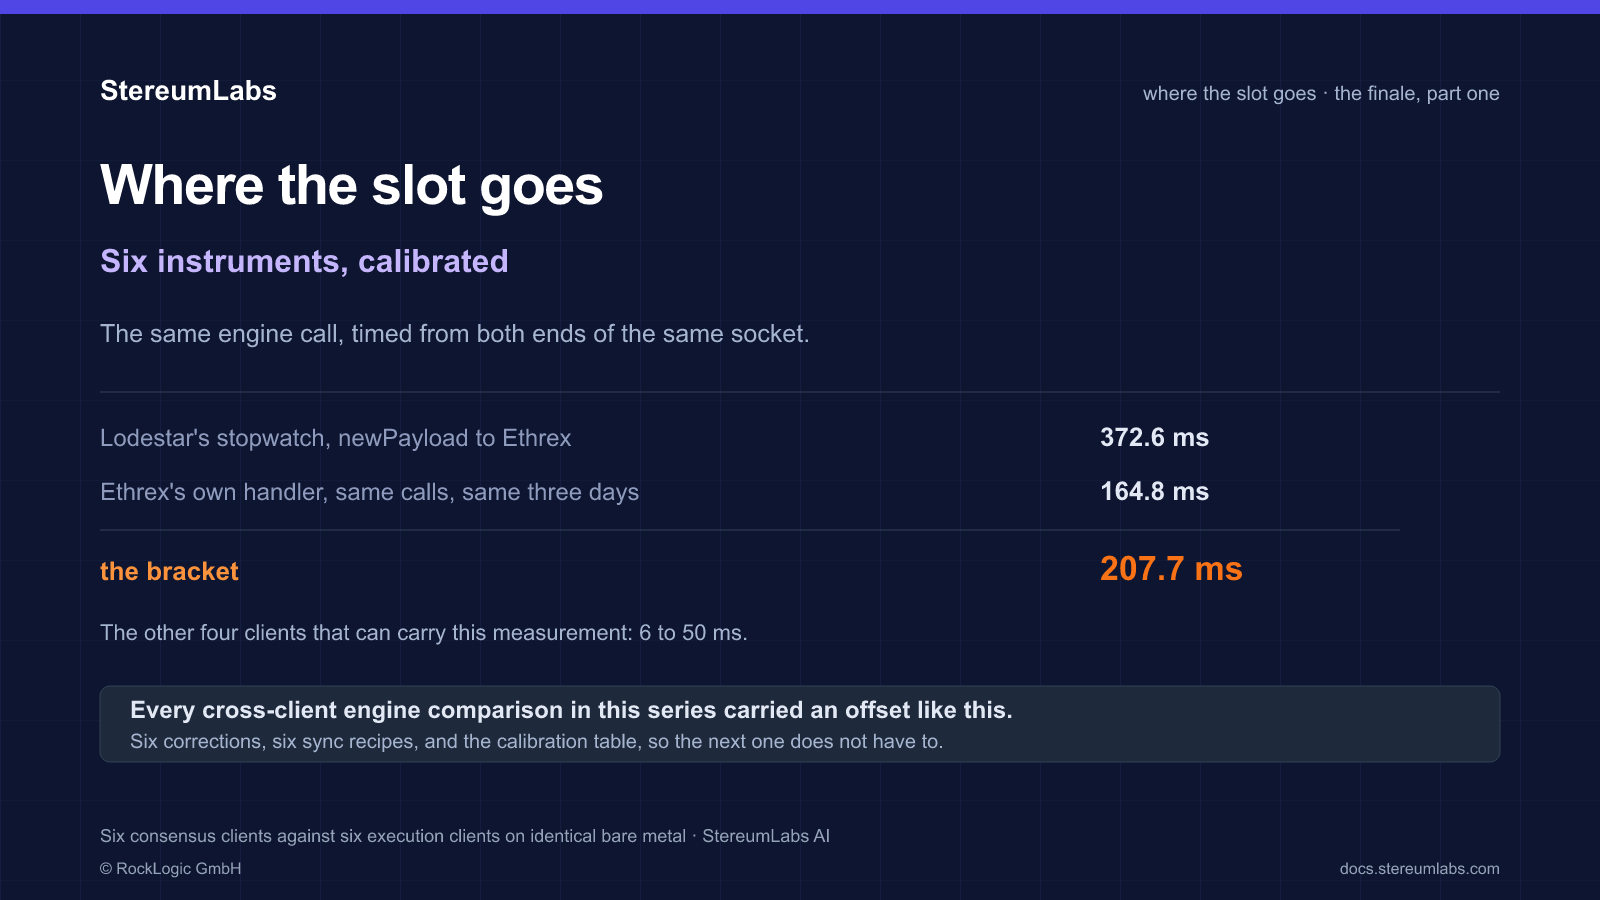
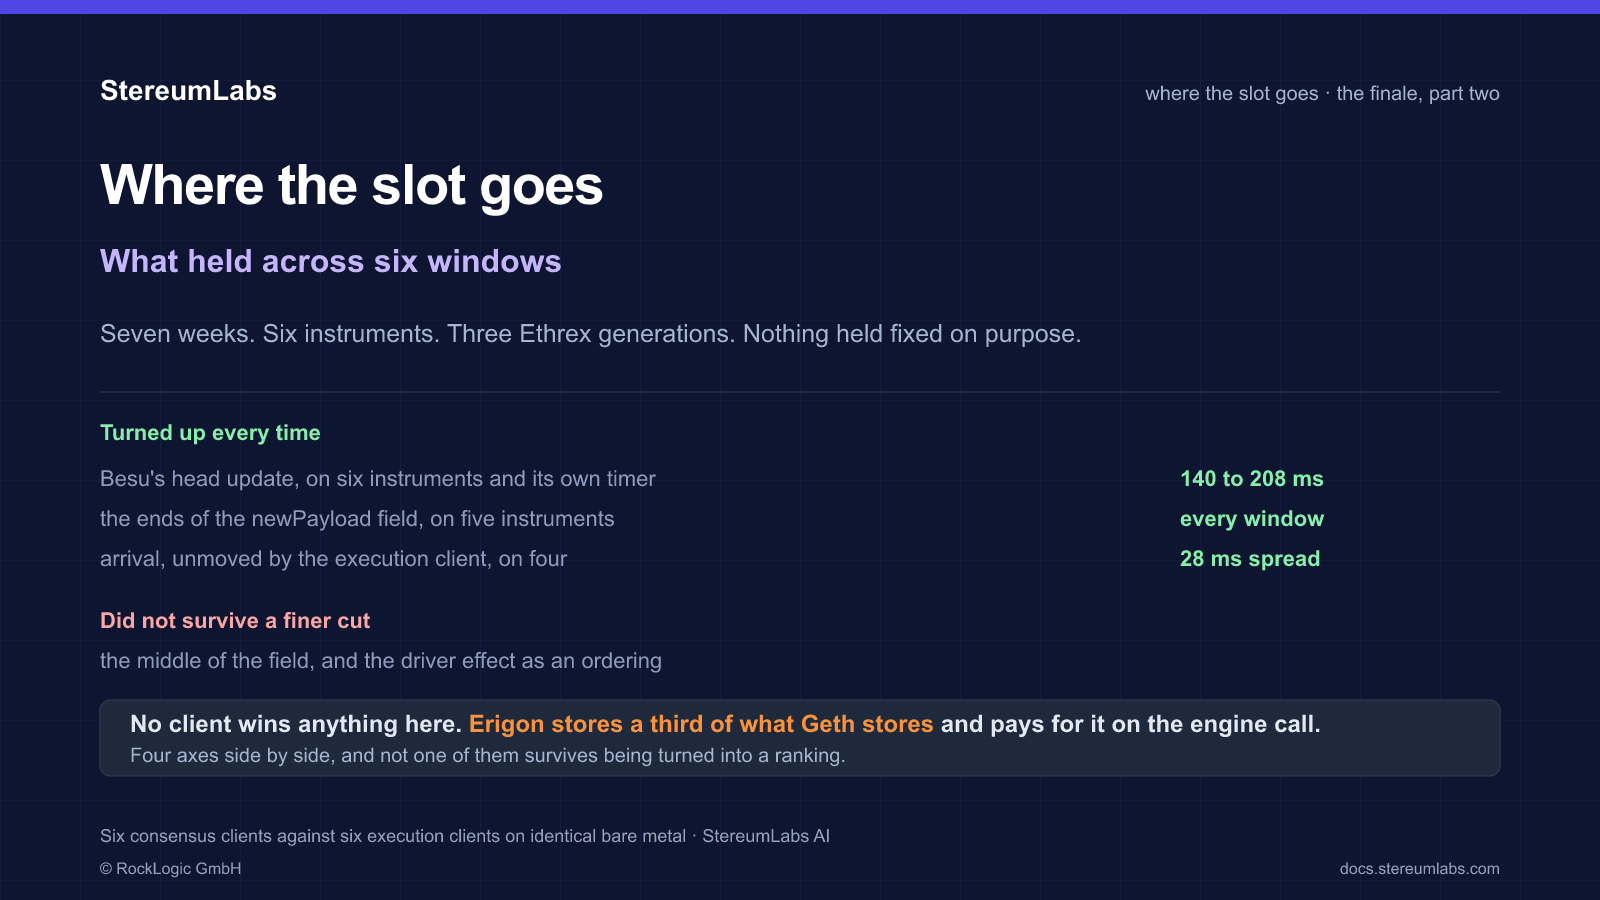
Three consensus clients timed the same engine calls on identical hardware. Only the extremes and Besu's 200 ms forkchoiceUpdated survive all three; the middle of the field permutes with the host.
To be continued
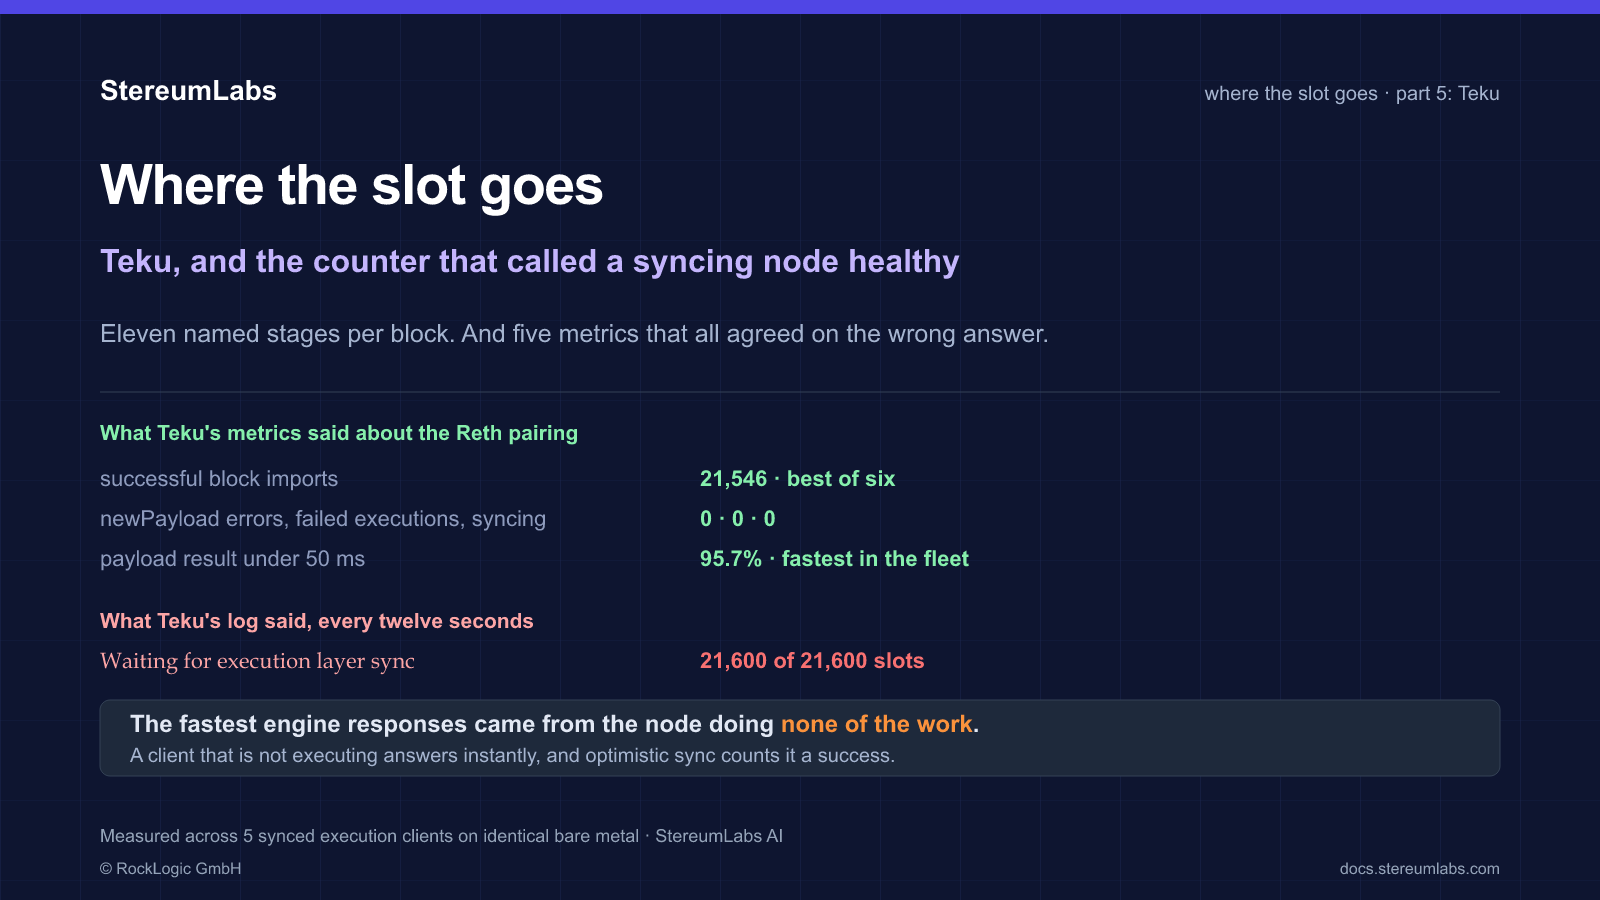
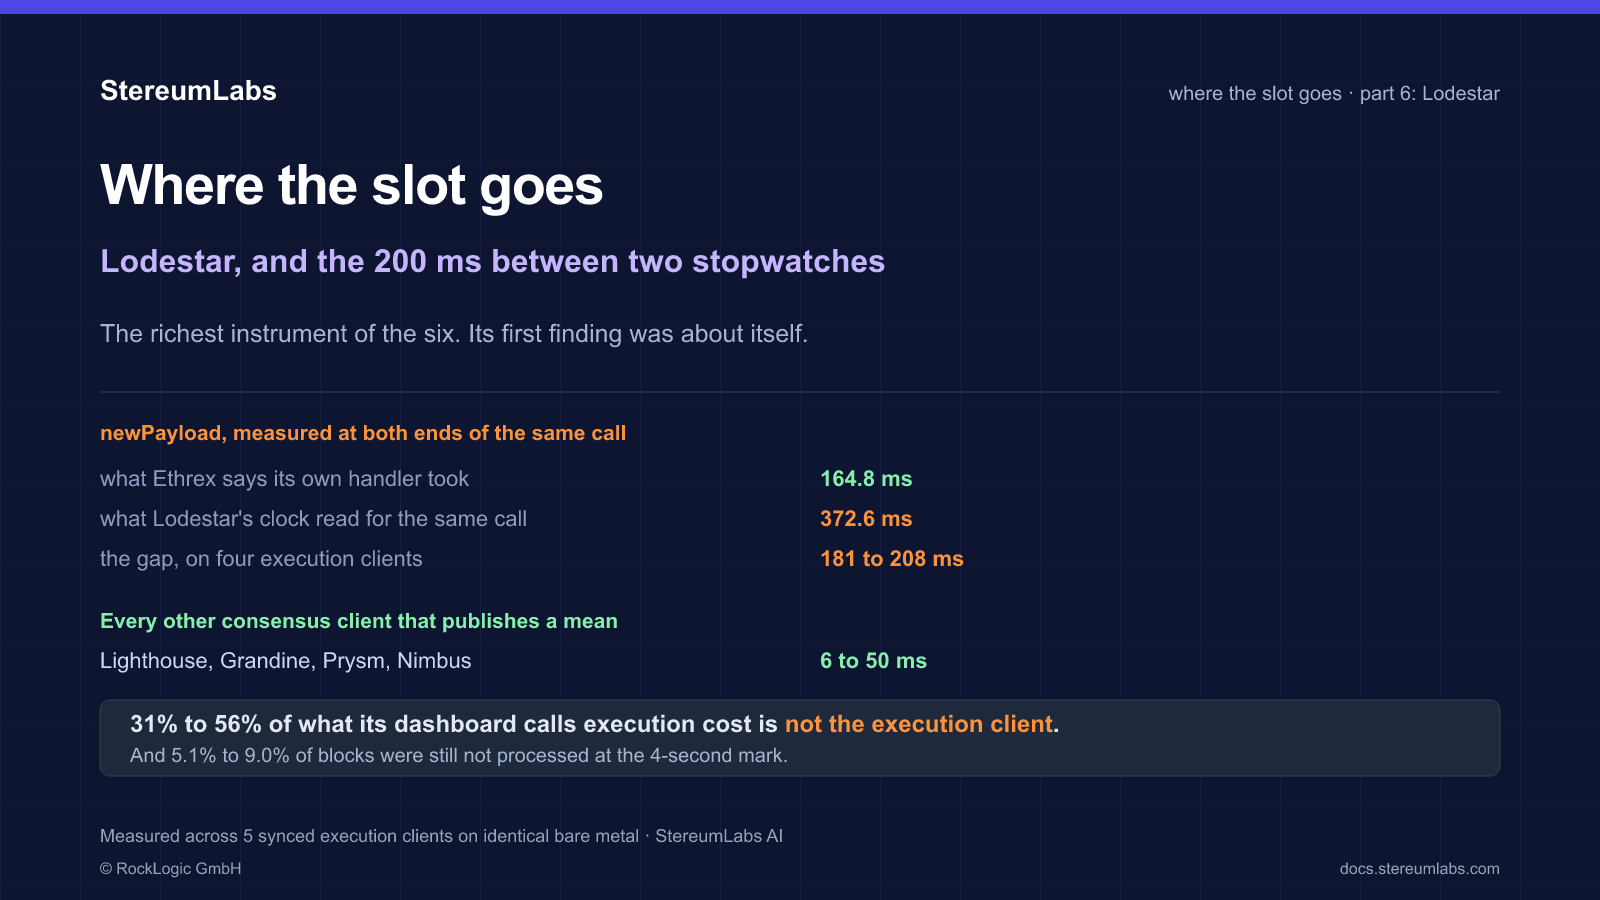
The same slot-timing question, taken to Teku, Lodestar and Grandine, each of which instruments the slot differently.
Pick your path
StereumLabs data serves different audiences. Jump to the page that matches your role.
Run institutional staking or RPC infrastructure. Compare resource budgets, validator performance, and upgrade impact across versions.
Pick an EC+CC combo for your hardware. Practical guides on peer counts, sync speed, and what to monitor.
Neutral, hardware-backed measurements with full methodology disclosure. Cite our datasets, reproduce our runs.
See how your EC or CC behaves across 42 pairings, multiple versions, and real workloads.
How we measure
We publish our scenarios, flags, hardware specs, and limitations so others can reproduce or critique our results.
Read the full methodology →Equalized conditions, documented config policy, no vendor allegiance. Every client gets the same scenario and the same resource budget.
Anchored on declared bare-metal in Vienna (Epyc 9654P, ZFS raidz1, dedicated NICs). Cloud profiles are disclosed and pinned.
Every run publishes versions, flags, environment hashes, and sampling metadata. You can rerun what we ran or critique what we measured.
New analysis lands roughly every week. Subscribe via RSS or reach out for custom runs on your fleet.