Execution Client Sync Speed: From 1.5 Hours to 8+ Days


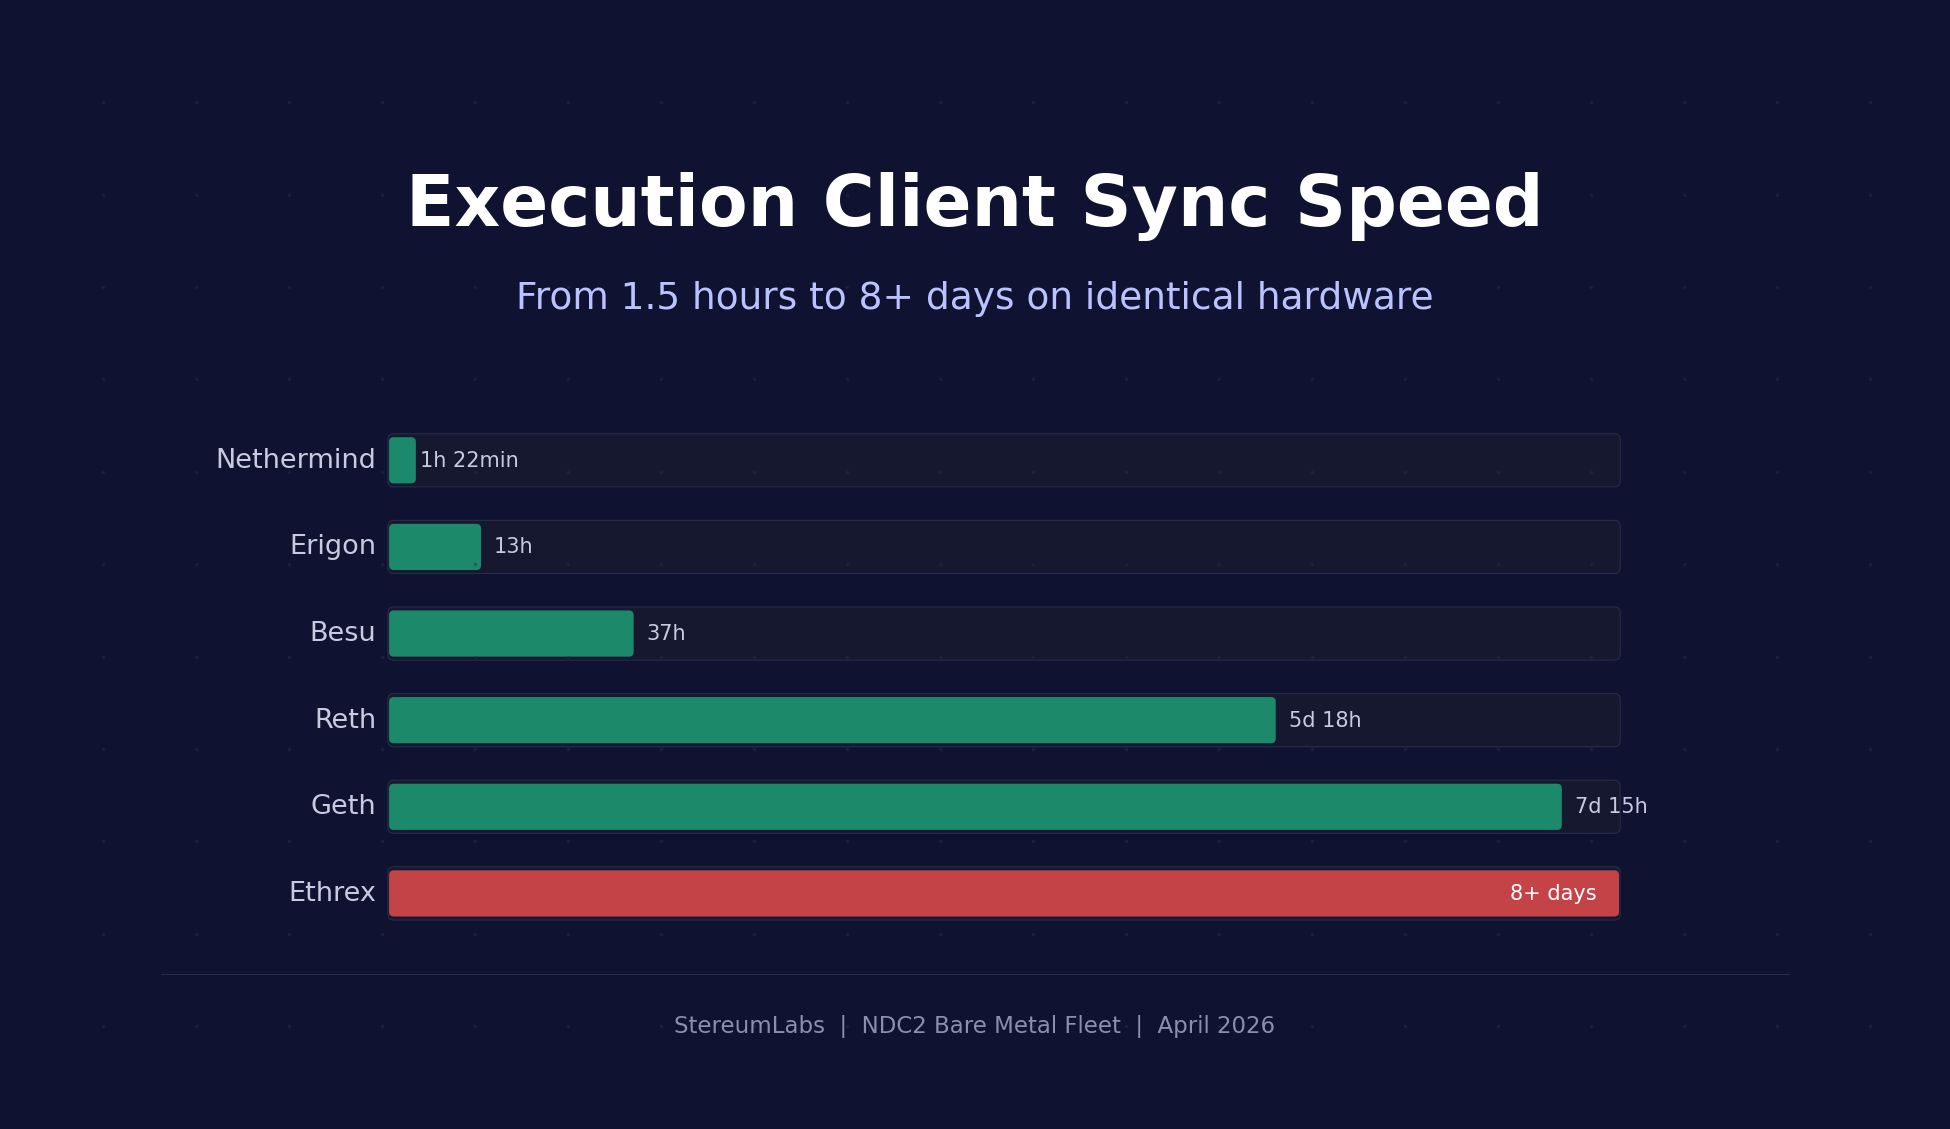
We deployed all 6 Ethereum execution clients from scratch on bare metal and tracked exactly how long each one took to fully sync. The results range from impressive to alarming.
Overview
On April 8, 2026 at 19:41 UTC, we deployed the entire NDC2 bare metal fleet from scratch. All 36 execution client instances (6 ECs × 6 consensus client pairings) started within a 12 second window. The chain tip was at block ~24,837,000 (slot ~14,071,100).
| Execution Client | Version |
|---|---|
| Besu | 26.2.0 |
| Erigon | v3.3.10 |
| Ethrex | 9.0.0 |
| Geth | v1.17.2 |
| Nethermind | 1.36.2 |
| Reth | v1.11.3 |
Each EC is paired with all 6 consensus clients (Grandine 2.0.4, Lighthouse v8.1.3, Lodestar v1.41.1, Nimbus multiarch-v26.3.1, Prysm v7.1.3, Teku 26.4.0). All nodes run on identical bare metal hardware with NVMe storage at our NDC2 datacenter in Vienna. Every EC runs on its own dedicated host, separate from the consensus client.
Four of six execution clients (Reth, Geth, Ethrex, Besu) allowed their paired consensus client to report "in sync" while the EC itself was still hours or days from completing its own sync. The CC's beacon_head_slot metric is not a reliable indicator of EC sync status. All findings in this post are based on EC container logs and metrics, not CC reported head slots.
Bare metal vs. cloud
This analysis focuses on our NDC2 bare metal fleet, where each node has dedicated CPU, RAM, and NVMe storage with no resource contention. We also run the same client combinations on Google Cloud Platform (GCP) instances, which are available to StereumLabs users for side by side comparison. The two environments serve different purposes: bare metal gives us a controlled, reproducible baseline where hardware is never the variable, while GCP reflects the reality many operators face with shared infrastructure, variable I/O performance, and cloud specific constraints like burst credits and network throttling. Sync behavior can differ significantly between these environments, so we encourage users to explore both datasets on our platform.
Results
| Rank | EC | Total Sync Time | Sync Method |
|---|---|---|---|
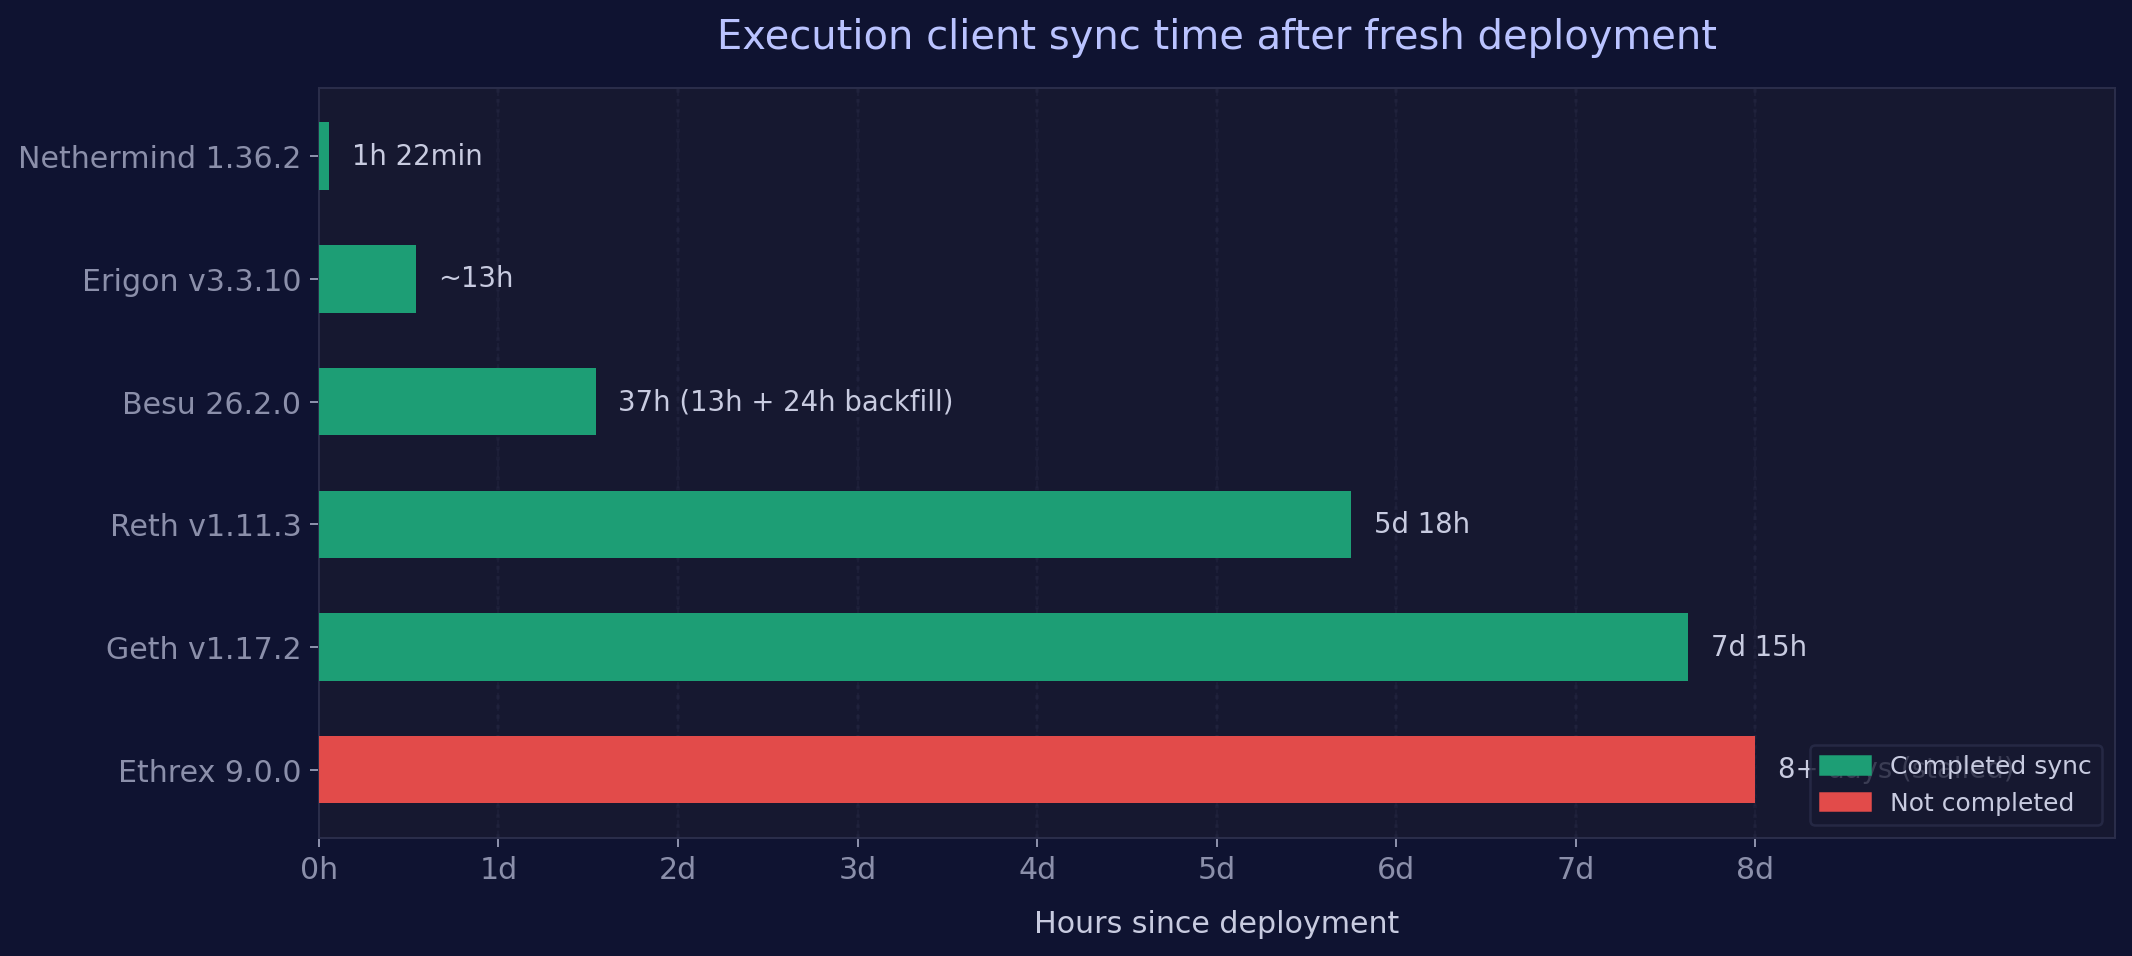
| 1 | Nethermind | ~1h 22min | Snap sync to pivot, then StateNodes |
| 2 | Erigon | ~13 hours | Staged sync (5K block batches) |
| 3 | Besu | ~13h snap + ~24h backfill = ~37h total | Pivot based snap sync + backward sync |
| 4 | Reth | ~5 days 18 hours | 14 stage pipeline (full replay) |
| 5 | Geth | ~7 days 15 hours | Snap sync (state healing bottleneck) |
| 6 | Ethrex | Not completed (8+ days) | P2P snap sync (stalled) |
Detailed sync breakdown
Nethermind 1.36.2: 1h 22min
Nethermind was the fastest client by a wide margin. Its container logs show a clean three phase sync:
Phase 1, FastHeaders (19:42 to 20:59, ~1h 17min): Nethermind set a pivot at block 24,837,019 and downloaded all headers. The sync mode transitioned through UpdatingPivot, FastHeaders, SnapSync, and finally StateNodes.
Phase 2, StateNodes (20:59 to 21:04, ~5min): World state download at the pivot point.
Phase 3, Block processing (21:04 onward): First "Block throughput" log appeared at 21:04 UTC, showing live block processing at 107 MGas/s and 850 tps. From this point, Nethermind was fully operational.
08 Apr 21:04:39 | Block throughput 107.72 MGas/s | 850.4 tps | blobs 12
Total: ~1 hour 22 minutes from cold start to processing live blocks.
Erigon v3.3.10: 13 hours
Erigon uses its unique staged sync pipeline. The sync Prometheus metric with per stage labels provides precise tracking:
- Headers, Bodies, and Senders: Jumped to block 24,767,999 within ~20 minutes. Erigon had pre existing frozen block data and only needed recent segments.
- Execution stage: Progressed in 5,000 block batches (24,768K to 24,773K to 24,778K and so on), advancing ~5K blocks every 60 to 90 minutes.
- Finish stage: Reached the chain tip at ~08:40 UTC on April 9.
Two Erigon instances (Lodestar and Teku pairings) required unscheduled process restarts 11 to 12 hours after deployment, indicating memory pressure during the execution stage.
Total: ~13 hours.
Besu 26.2.0: 37 hours (13h snap + 24h backfill)
Besu performed a pivot based snap sync from block 0:
Phase 1, Snap sync (19:42 to Apr 9 08:57, ~13h 15min): Besu downloaded headers backward from pivot 24,837,019 to block 0 while simultaneously fetching world state. The ethereum_blockchain_height metric starts at block 15,537,394, which is the first post Merge block (The Merge occurred at block 15,537,393 on September 15, 2022). Besu only needs to forward execute post Merge blocks since pre Merge PoW data is handled differently.
Sync completed successfully with pivot block 24839885
Phase 2, Backward sync (Apr 9 08:57 to Apr 10 08:54, ~24h): After pivot sync completed, Besu backfilled pre Merge block bodies and receipts in a separate backward pass.
Starting a new backward sync session
...
Current backward sync session is done
Total: ~13h 15min to live operations, ~37h for complete historical data.
Block 15,537,394 is the first Proof of Stake block on Ethereum mainnet. Besu's snap sync downloads headers all the way back to genesis, but it only needs to execute blocks from The Merge forward since pre Merge PoW blocks use a different execution model. The ethereum_blockchain_height metric reflects this forward execution boundary, not an incomplete database.
Reth v1.11.3: 5 days 18 hours
Reth runs a sequential 14 stage pipeline from scratch. Container logs with Finished stage messages provide exact timing for every stage:
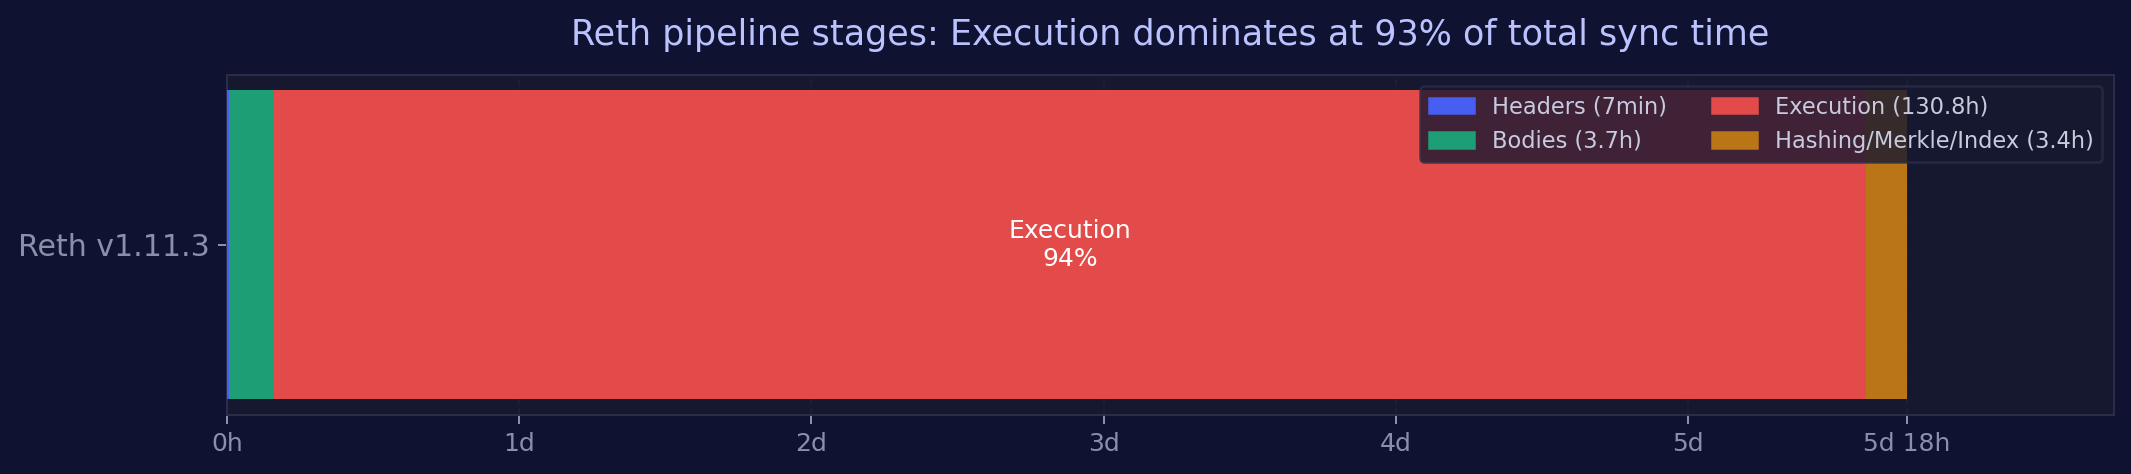
| Stage | Name | Started | Finished | Duration |
|---|---|---|---|---|
| 1/14 | Headers | Apr 8, 19:45 | Apr 8, 19:53 | 8 min |
| 2/14 | Bodies | Apr 8, 19:53 | Apr 8, 23:35 | 3h 42min |
| 3/14 | SenderRecovery | Apr 8, 23:35 | Apr 8, 23:35 | instant |
| 4/14 | Execution | Apr 8, 23:35 | Apr 14, 10:25 | 5d 10h 50min |
| 5/14 | PruneSenderRecovery | Apr 14, 10:25 | Apr 14, 10:25 | instant |
| 6/14 | MerkleUnwind | Apr 14, 10:25 | Apr 14, 10:25 | instant |
| 7/14 | AccountHashing | Apr 14, 10:25 | Apr 14, 10:34 | 9 min |
| 8/14 | StorageHashing | Apr 14, 10:34 | Apr 14, 11:40 | 1h 6min |
| 9/14 | MerkleExecute | Apr 14, 11:40 | Apr 14, 12:48 | 1h 7min |
| 10/14 | TransactionLookup | Apr 14, 12:48 | Apr 14, 13:47 | 59 min |
| 11 to 14 | IndexHistory, Prune, Finish | Apr 14, 13:47 | Apr 14, 13:47 | seconds |
The Execution stage consumed 93% of the total sync time, replaying all 24.8 million blocks sequentially. Headers downloaded in 8 minutes and bodies in under 4 hours, but the actual block execution took over 5 days.
Total: 5 days 18 hours. Pipeline finished April 14, 13:47 UTC.
Geth v1.17.2: 7 days 15 hours
Geth performed a snap sync from genesis with parallel header and state downloads:
Headers (19:42 to ~01:00 Apr 9, ~5h): Geth's header download progressed at ~1.25M headers/hour. Early logs showed "Syncing beacon headers downloaded=512 left=24,836,569 eta=4h20m". Geth explicitly rejected live CC blocks during this phase: "Ignoring payload while snap syncing".
State download (parallel with headers, ~1.5h): State download started simultaneously and progressed rapidly, showing "state download synced=0.15% eta=1h24m" at minute 10.
State healing (dominant bottleneck): After headers and initial state were downloaded within hours, state healing ran for days. This is the phase where Geth patches gaps and inconsistencies in the downloaded state trie.
Snap sync complete: April 16, 10:32 UTC.
Switching from snap-sync to full-sync reason="snap-sync complete"
Total: ~7 days 15 hours. State healing was the multi day bottleneck.
Ethrex 9.0.0: Not completed (8+ days)
Ethrex operates in dual mode: it immediately processes live blocks via the engine API while running P2P snap sync in the background. This means the paired CC tracks the chain head within seconds of startup, but the EC lacks complete historical state.
Live blocks (immediate): At 19:42:32 UTC, Ethrex received its first engine payload for block 24,837,020, just 26 seconds after startup.
P2P snap sync (ongoing): Snap sync started at 19:42:35. After ~3 hours it reached the "Requesting Bytecodes" phase. However, a restart at some point reset all progress. As of April 16, the snap sync status showed:
P2P Snap Sync | elapsed 00h 00m 07s | peers 7 | step Downloading Headers
The sync had effectively restarted from scratch with minimal peer connectivity.
Total: Not completed after 8+ days. The P2P snap sync is effectively stalled.
Once Ethrex completes its initial sync, our experience with it has been excellent. Block building performance and attestation behavior are on par with established clients, as shown in our Nimbus block building analysis. Getting to that point, however, requires significant patience and may involve manual restarts. The P2P snap sync implementation is still maturing.
We have developed internal workflows and tooling to work around the current sync challenges, and these are available to StereumLabs users who want to run Ethrex in their setup. Additionally, the LambdaClass team is actively working on newer Ethrex versions that are expected to address many of these sync related issues. A deeper analysis of Ethrex sync strategies and workarounds is outside the scope of this post, but we may cover it in a dedicated article in the future.
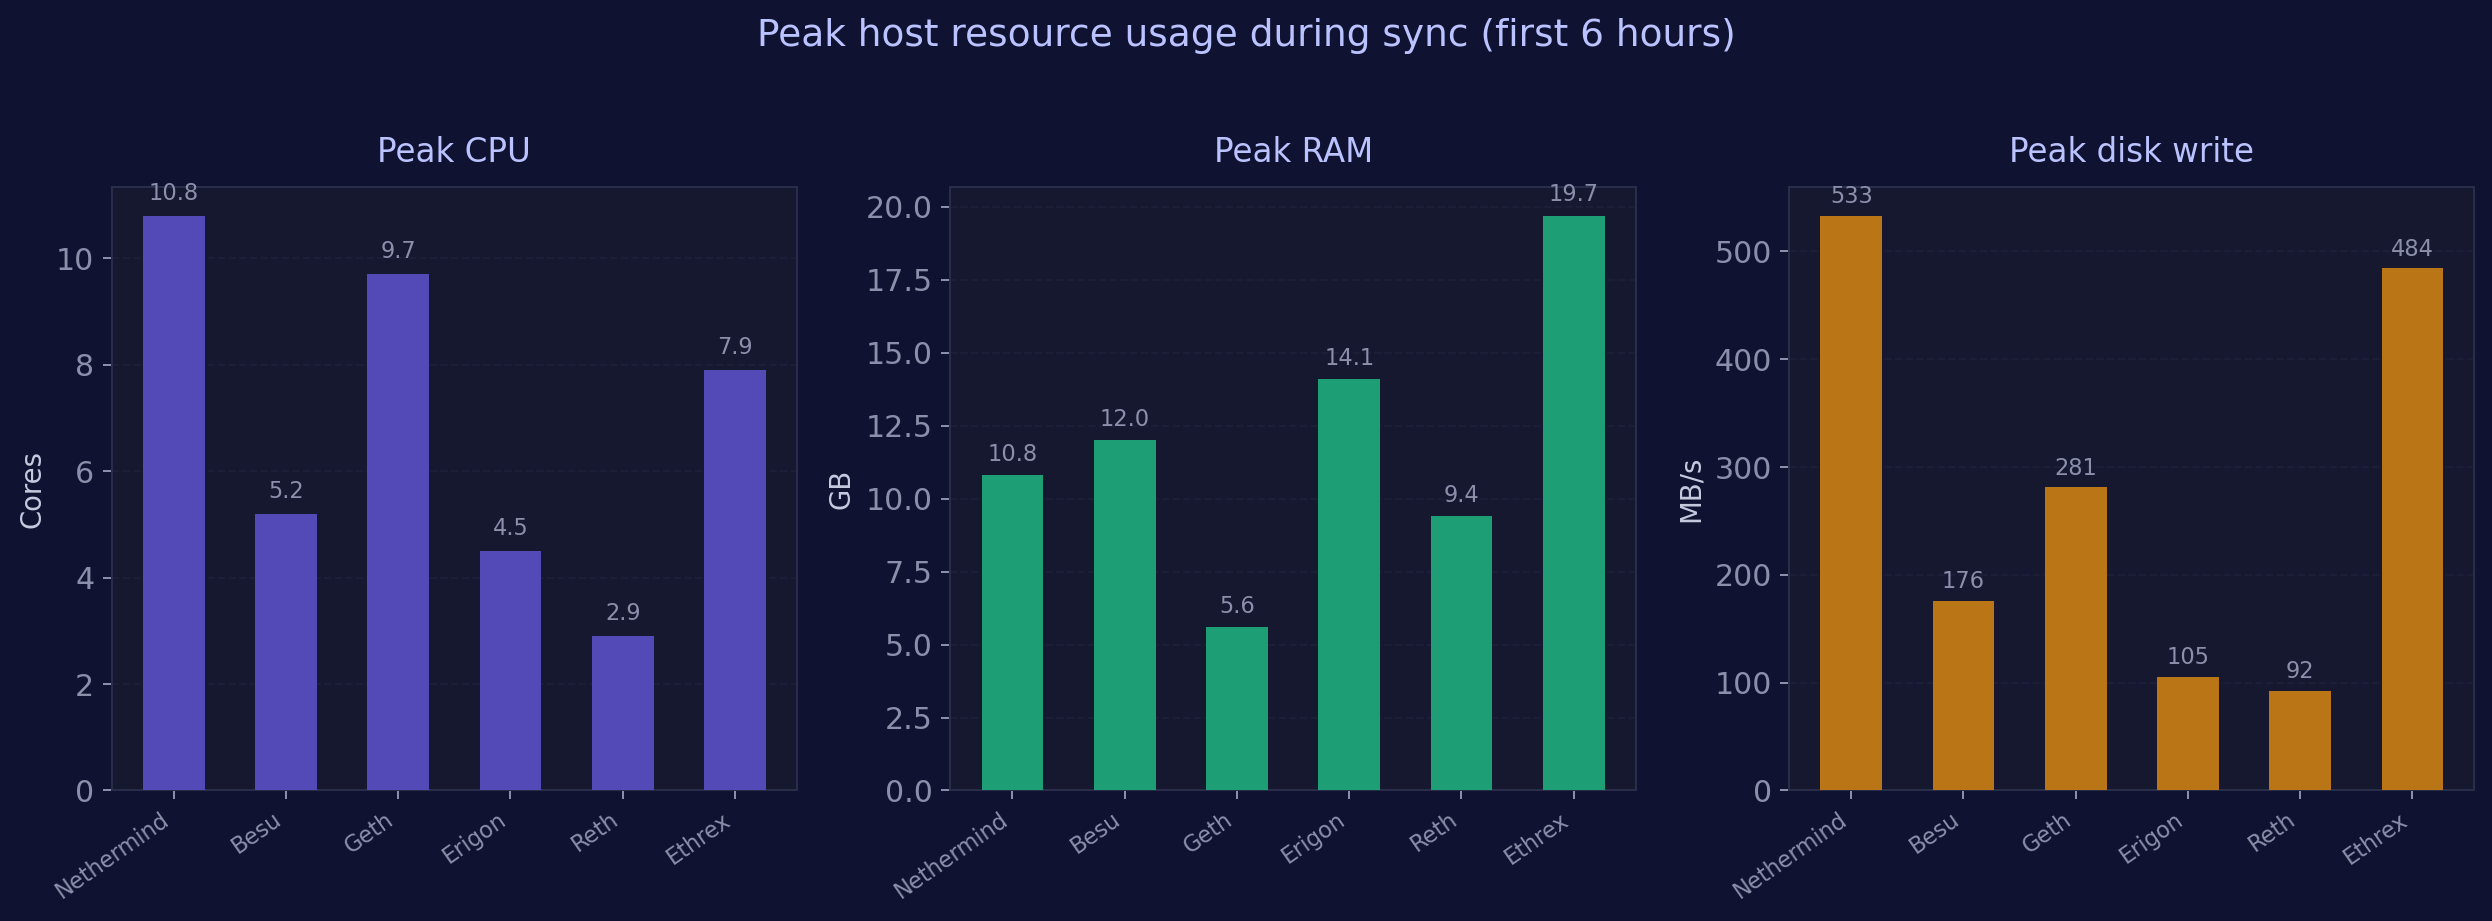
Peak resource usage during sync
These are maximum values observed on each EC host during the first 6 hours after deployment (the peak sync burst period), measured via node exporter. Since each EC runs on its own dedicated host with no other significant services, these numbers reflect EC resource consumption directly.
| Metric | Nethermind | Besu | Geth | Erigon | Reth | Ethrex |
|---|---|---|---|---|---|---|
| Peak CPU (cores) | 10.8 | 5.2 | 9.7 | 4.5 | 2.9 | 7.9 |
| Peak RAM (GB) | 10.8 | 12.0 | 5.6 | 14.1 | 9.4 | 19.7 |
| Peak Disk Read (MB/s) | 561 | 27 | 44 | 176 | 61 | 219 |
| Peak Disk Write (MB/s) | 533 | 176 | 281 | 105 | 92 | 484 |
| Peak Net RX (MB/s) | 111 | 33 | 98 | 75 | 96 | 86 |
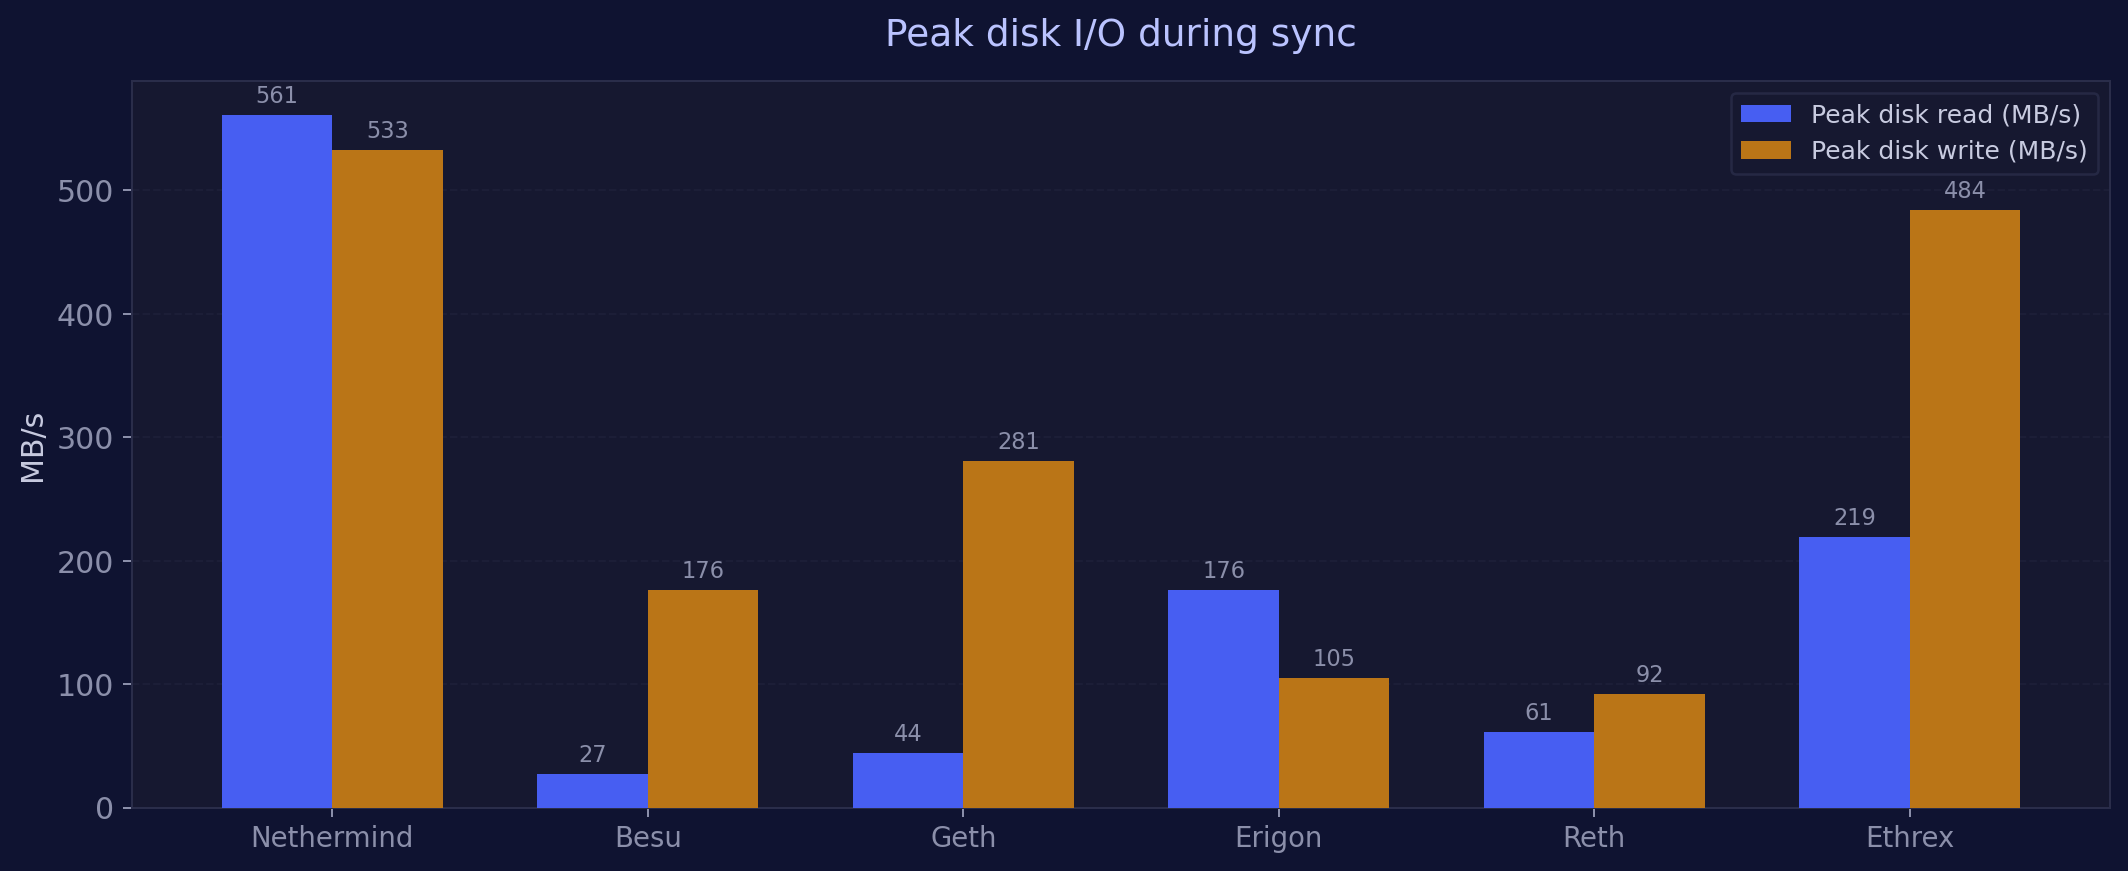
Nethermind was the heaviest on disk I/O: 561 MB/s reads and 533 MB/s writes during its snap sync burst. It traded high resource intensity for the fastest sync by far.
Geth was CPU intensive (9.7 cores) but had the lowest memory footprint (5.6 GB) of any EC during sync.
Erigon consumed the most RAM among established clients (14.1 GB) despite being mid pack on sync speed, consistent with its known memory pressure pattern during staged execution.
Ethrex had the highest RAM usage overall (19.7 GB) and very high disk writes (484 MB/s), driven by simultaneous live block processing and background snap sync.
Reth was the most resource efficient during the initial 6 hour window: lowest CPU (2.9 cores), moderate RAM (9.4 GB), minimal I/O. However, this is misleading because Reth's pipeline was still in the Bodies download stage during this window, with the heavy Execution stage starting later and running for 5+ days.
Key observations
1. Sync speed varies by orders of magnitude
The gap between the fastest (Nethermind, 1.5h) and the slowest completed sync (Geth, 7.5 days) is a factor of 120×. For operators, this means the difference between being back online during a lunch break versus being offline for more than a week.
2. "In sync" does not mean synced
This is the most operationally dangerous finding. Reth, Geth, Ethrex, and Besu all reported themselves as ready to serve the consensus client while their historical sync was far from complete. Operators monitoring only CC metrics (head slot, attestation inclusion) would see a healthy node while the EC was still days from full sync.
3. NVMe storage is essential for fast sync
Nethermind's 561 MB/s peak disk reads demonstrate why: its snap sync strategy saturates fast storage to finish quickly. On slower drives (SATA SSD or HDD), the sync time would scale proportionally, potentially turning Nethermind's 1.5 hours into many hours.
4. Erigon's staged sync is predictable but slow
Erigon's 5K block batch processing through the execution stage is the primary bottleneck. The staged approach provides clear progress visibility and checkpointing, but at the cost of being 10× slower than Nethermind. Two instances also required restarts due to memory pressure during this phase.
5. Reth and Geth need days for historical execution
Both clients must replay the entire chain history. Reth does this sequentially through its Execution stage (5+ days), while Geth's bottleneck is state trie reconciliation after its initial snap download. These are fundamentally different bottlenecks but produce similar multi day timelines.
6. Ethrex syncing requires patience
Ethrex delivers solid performance once fully synced, as our previous analyses have shown. The challenge is getting there. Its P2P snap sync is still maturing, and a restart during our test reset all progress. Peer connectivity (7 peers vs. 90+ for other clients) suggests the sync P2P discovery needs further work. The LambdaClass team is actively iterating, and upcoming Ethrex versions are expected to improve the sync experience considerably. For operators willing to invest patience (or use alternative bootstrapping methods), Ethrex is absolutely viable in production once it reaches the chain tip. We offer tooling and guidance for Ethrex sync on StereumLabs for those who want to get started today.
Relation to block building performance
In our previous analysis of Nimbus block building across 5 ECs, we found that Erigon's slow block execution (423 to 567ms per imported block) causes it to deliver empty block payloads. This sync investigation confirms the pattern: Erigon's execution pipeline is the consistent bottleneck, whether processing historical blocks during sync or building new blocks for proposals.
Reth was excluded from that analysis because it had not completed its initial sync at the time. This post explains why: its full pipeline takes nearly 6 days.
Methodology
- All data sourced from Prometheus (
prometheus-colddatasource) and Elasticsearch (Filebeat container log shipping) on the StereumLabs Grafana instance. - EC sync completion determined from EC container logs:
Finished stage(Reth),Snap sync complete(Geth),Sync completed successfully/Backward sync session is done(Besu),Block throughputfirst appearance (Nethermind),P2P Snap Syncstatus messages (Ethrex),syncmetric per stage progression (Erigon). - Peak resource usage measured via
node_exportermetrics withmax_over_time(...[6h])queries at each EC's dedicated host. - All nodes run on NDC2 bare metal hardware (Vienna), eliminating cloud induced variance.