Consensus Clients Dashboards
This page defines the standardized structure for Stereum’s Execution Layer dashboards, outlining the client-specific configurations required for each implementation and the guiding principles that ensure cross-client consistency and comparability.
1. Introduction
This document specifies the structure planned for creating client consensus layer dashboards that will be integrated into the Stereum monitoring ecosystem, extending its existing telemetry capabilities with deeper instrumentation and standardized cross-client comparability
These Grafana dashboards present a comprehensive visualization of key Consensus Layer (CL) metrics, while the node operates in conjunction with a selected Execution Layer (EL) client. Because each consensus client exposes its own set of Prometheus metrics, with variations in naming conventions, scope, and metric granularity, every CL implementation requires a dedicated dashboard configuration.
Nevertheless, to preserve consistency and facilitate navigation, all dashboards adhere to a common structural template. This uniform layout organizes metrics into coherent sections, ensuring that equivalent concepts are grouped together across different clients. Such consistency simplifies interpretation and comparison between client dashboards.
2. Dashboard Sections Overview
Each dashboard is divided into the following major sections:
2.1 Basic System Resource Usage (CPU, Memory, Network)
This section monitors the fundamental system-level resources utilized by both the Execution Layer and the Consensus Layer clients. Metrics such as CPU utilization, resident memory consumption, and network throughput provide immediate insights into the node’s hardware and process performance. They are particularly useful for diagnosing resource bottlenecks, identifying abnormal spikes, and ensuring that both clients operate within expected system limits.
2.2 Beaconchain Statistics
The Beaconchain Statistics section provides a high-level overview of the beaconchain protocol stats and the client synchronization. Typical metrics include:
- Node slot head (the latest slot known to the client)
- Slots behind (difference from the network head, indicating sync lag)
- Reorgs (tracking reorgs that happened in the network)
- Peers (number of connected peers)
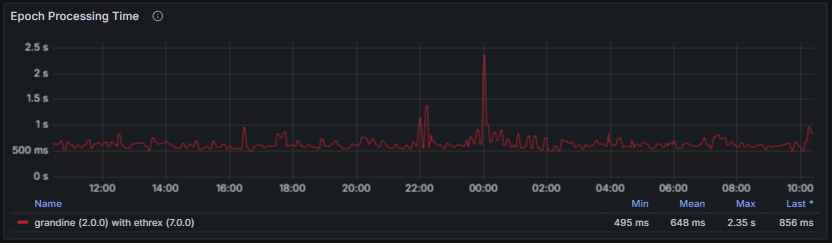
- Block/Epoch Processing Time (block and epoch processing time shows whether the client can keep up with chain state transitions and stay synced)
Collectively, these indicators allow the operator to quickly assess the synchronization health of the node and detect potential delays in slot propagation or processing.
2.3 PeerDAS
PeerDAS metrics provide visibility into Data Availability Sampling (DAS), custody group participation, blob processing, and execution-layer interactions. Typical metrics include:
- Custody Groups (custody assignments for DAS, ensuring correct sampling responsibilities)
- Data Columns Sidecar Computation (workload when computing column sidecars needed for data sampling)
- Data reconstruction (ability to rebuild original data from sampled chunks for verification)
- Data Columns Sidecar Gossip Verification (verification of sidecars received over gossip to ensure only valid data is accepted)
- Data Columns Sidecar Computation Inclusion Proof Verification (checks of inclusion proofs for sidecar computations to confirm data integrity)
- KZG Batch Verification (performance of batch-verifying KZG commitments used in blob data validation)
- Blobs v2 (performance for the updated blob format used in the DAS pipeline)
2.4 Networking
The Networking section focuses on peer-to-peer connectivity and network stability. It displays metrics such as the number of connected peers, connection and disconnection rates, and peer churn frequency, peer client diversity/preference and bandwidth usage. These metrics help evaluate how well the client maintains connections to the network, which directly affects its ability to receive and propagate blocks and transactions.
2.5 Gossipsub/libp2p
This section provides a detailed analysis of the performance and behavior of the GossipSub and libp2p protocol implementation of the client. These metrics help evaluate the efficiency of message propagation, mesh connectivity, and overall protocol stability. By tracking parameters such as message throughput, mesh density, and duplicate message rates, the report aims to identify trends and potential bottlenecks in the gossip layer.
2.6 Discv5
The Discv5 metrics section provides an overview of the network discovery process and its efficiency in maintaining connections with mesh peers. These metrics typically include indicators such as discovery bandwidth usage, number of active sessions, discovery request rates, and peers found through lookup queries. By analyzing these parameters, the section aims to evaluate the responsiveness, stability, and overall effectiveness of the client’s implementation of the Discv5 protocol in establishing and sustaining peer connectivity across the network.
2.7 Storage
The Storage section provides visibility into the client’s database subsystem, typically built on key-value stores such as RocksDB or LevelDB. Representative metrics include:
- Total database size and on-disk file count.
- Read/write throughput and latency.
- Compaction time and pending compaction data volume.
These metrics are critical for diagnosing performance bottlenecks in block import, transaction execution, or state access operations.
2.8 Language-Specific Metrics
Each consensus client is implemented in a different programming language and runtime environment, such as Java (for Teku), Go (for Prysm), or Rust (for Lighthouse). This section exposes language-specific runtime metrics, including:
- Memory usage
- Garbage collection or memory reclamation metrics.
Tracking these values helps with client-specific tuning and performance optimization, particularly for adjusting JVM heap sizes, Go GC thresholds, or Rust memory limits.
3. Charts Explained and Examples
Each CL dashboard provides a detailed view of client-specific metrics while allowing the user to correlate data with the EL client that the CL client is operating alongside. At the top of the dashboard, a selection panel allows you to choose the associated EL client. When multiple versions are available, a drop-down list enables you to select the desired configuration. This ensures that the metrics displayed correspond to the exact EL–CL pairing currently being monitored.
![]()
It is recommended to maintain a minimum dashboard time range of 24 hours when visualizing metrics. A shorter time window may lead to incomplete datasets and render certain charts empty due to metric collection intervals or temporary data gaps. Maintaining a longer range provides a more stable visualization and allows for easier identification of performance trends over time.
To enhance readability and facilitate the comparison of metrics across different clients, comparable metrics are consistently represented using the same color coding. However, it is important to note that the scope and implementation of a given metric may vary between clients. For example, two clients may employ different strategies to note peers and give them a score, while a third client may not implement scoring at all. These variations in metric scope should be taken into account when interpreting the data.
3.1 Basic System Resource Usage (CPU, Memory, Network)
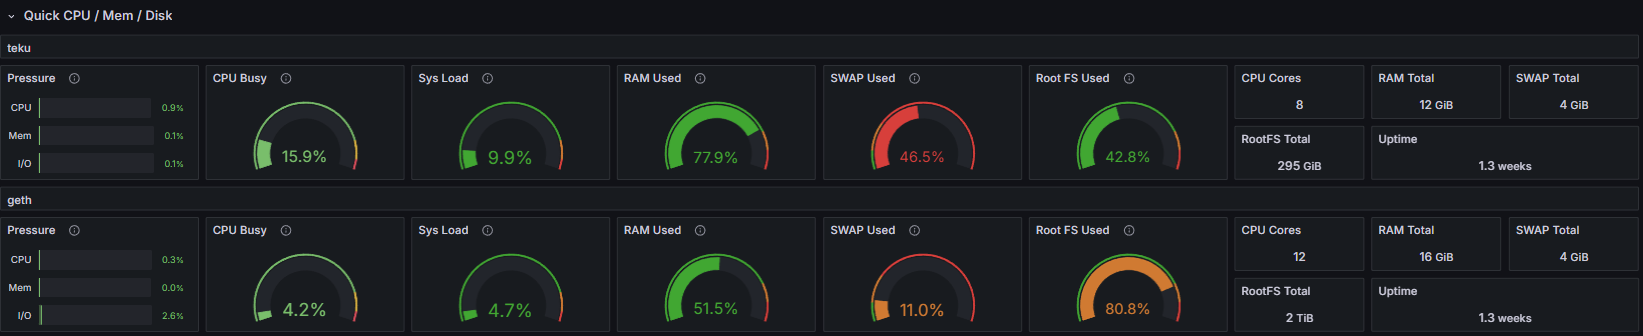
This section displays fundamental system resource metrics for the node running both the Execution Layer and the Consensus Layer clients. These metrics mirror those presented in the System Resource Utilization (EL & CL) dashboards.
3.2 Beaconchain Stats
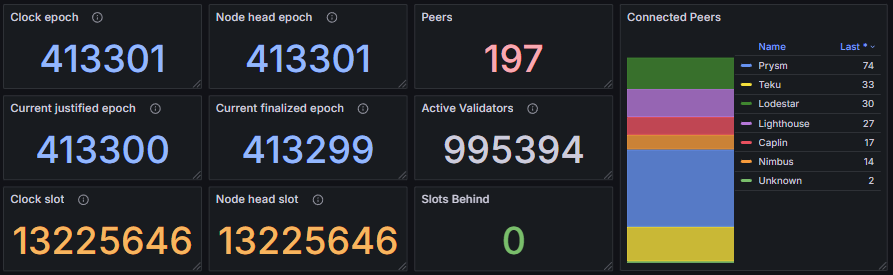
The Beaconchain stats section provides key indicators of synchronization status and chain progression within the Ethereum consensus layer. The clock epoch and node head epoch display the global and local epoch states, while the current justified and finalized epochs reflect the latest points of achieved network finality. Metrics such as the clock slot and node head slot show the client’s current position in the chain, and the slots behind metric indicates any synchronization lag. The peers metric reports the number of connected peers and their distribution, and the active validators metric tracks the total number of validators participating in the current epoch.
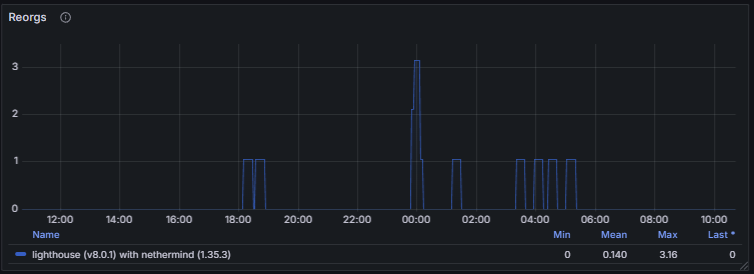
Reorgs measure occasional chain reorganizations that may occur during fork choice updates.
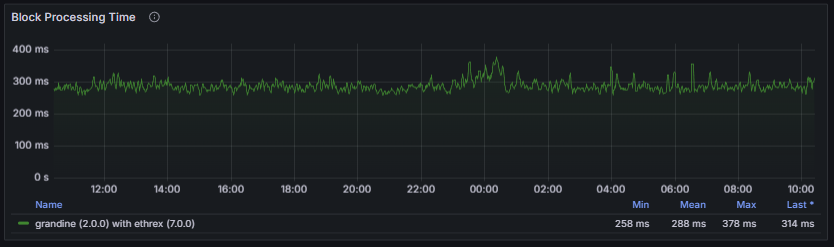
The block processing time and epoch processing time provide essential insight into a client’s ability to keep pace with chain progression. Excessive processing delays indicate that the client may struggle to follow the head of the chain, especially during high network load or increased computational demand. A healthy node maintains consistently low and stable processing times, with no sustained spikes and with values well below the slot duration window, ensuring it can reliably execute state transitions, stay fully synchronized, and contribute to overall network stability.
3.3 PeerDAS
This section presents the PeerDAS metrics activated following the Fusaka upgrade. It provides visibility into Data Availability Sampling (DAS), blob and data column sidecar processing, custody group participation, and interactions with the execution layer. Although these metrics were introduced recently and follow recommended conventions intended to promote standardization, client support remains heterogeneous. As a result, not all consensus clients expose the full set of PeerDAS-related metrics, and some provide only a limited subset.
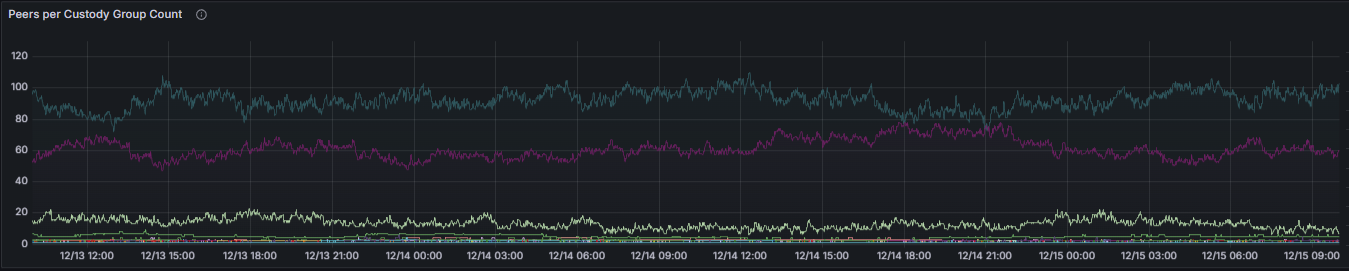
The Peers per Custody Group metric reports the number of connected peers serving each custody group for which the node is responsible. Custody groups define responsibility for specific data columns. An insufficient number of peers per custody group reduces redundancy and increases the risk of data unavailability, thereby weakening DAS guarantees.

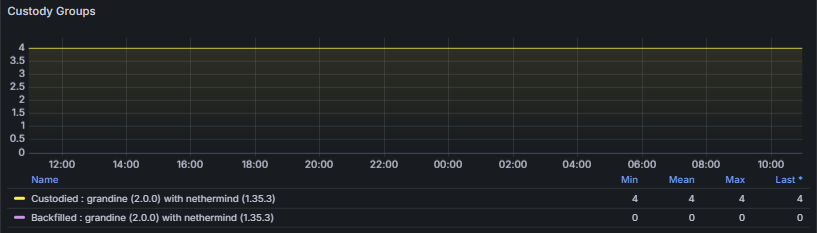
The Custody Groups metrics indicate both the total number of custody groups currently assigned to the node and the number of custody groups for which historical data has been backfilled. Under the current Ethereum protocol, the number of custodied groups is fixed at four for all non-validating nodes by consensus parameters. A constant value of four is therefore expected under normal conditions and indicates correct protocol participation. Deviations from this value may point to configuration issues, client bugs, or protocol-level anomalies. Super-nodes are expected to custody and follow all 128 columns.
Several Data Column Sidecar processing latencies are also monitored:
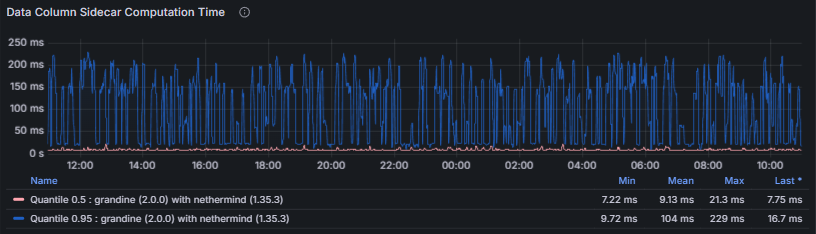
- Data Column Sidecar Computation measures the time required to compute data column sidecars. Sidecar computation lies on the critical path for blob availability; excessive computation time may result in missed gossip windows or delayed downstream verification.
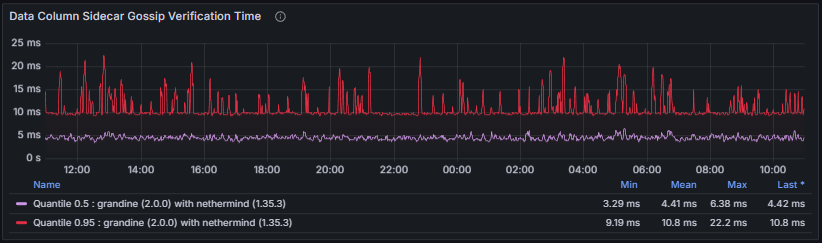
- Data Column Sidecar Gossip Verification measures the time spent verifying sidecars received via gossip. Efficient gossip verification is essential to prevent the propagation of invalid data and to ensure timely block and blob processing.
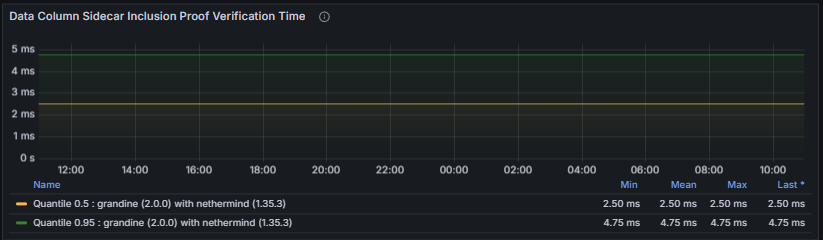
- Data Column Sidecar Inclusion Proof Verification measures the time required to verify inclusion proofs linking sidecars to their corresponding beacon blocks. Failures or sustained delays in this step undermine data availability guarantees and compromise protocol correctness.
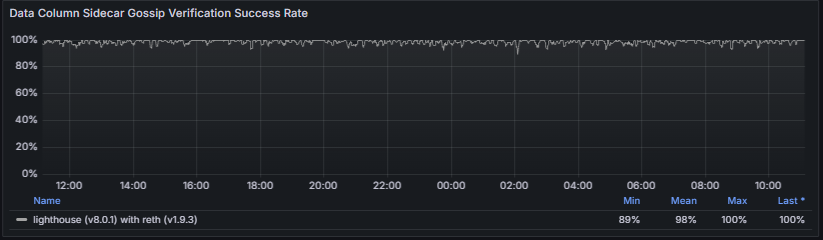
To complement the Data Column Sidecar latency metrics, the Gossip Verification Success Rate tracks the ratio of successful to attempted data column sidecar processing operations. A low success rate directly degrades the node’s ability to participate in DAS and may lead to data unavailability or protocol violations.
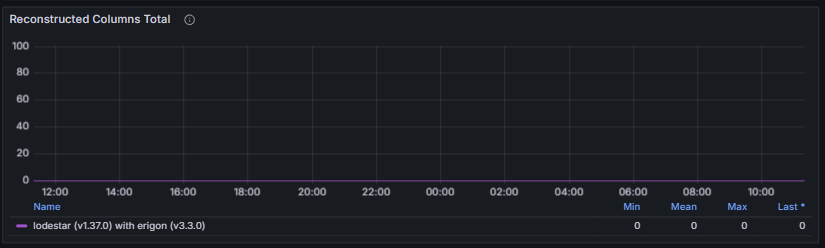
Data Availability Reconstruction is a fallback mechanism intended to recover missing data columns using erasure coding. Excessive reconstruction increases computational load and typically indicates underlying data propagation issues. In the absence of activated super nodes, gossip propagation is assumed to provide complete column availability, rendering reconstruction inactive. Reconstruction is tracked using two metrics. :
- Reconstruction Time: Time required to reconstruct missing data columns
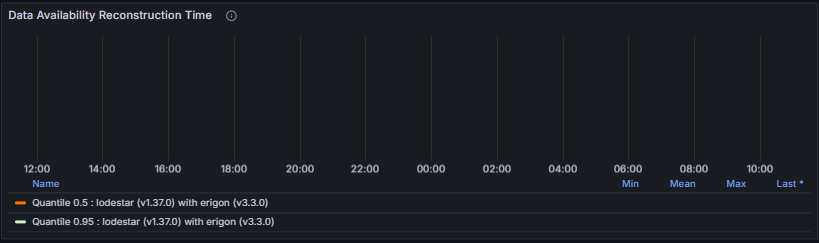
- Reconstructed Columns Total: Number of data columns reconstructed by the node
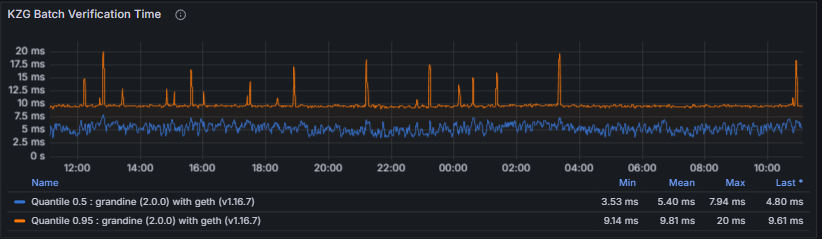
KZG Batch Verification Time measures the time spent verifying KZG cryptographic commitments for batches of data columns. KZG verification is critical to blob validity; slow verification risks falling behind slot processing and may result in missed attestations or block proposals.
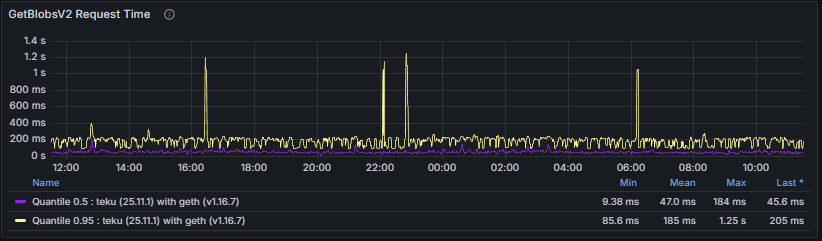
To conclude the PeerDAS section, the dashboard presents two metrics related to execution-layer (Engine API) blob retrieval. GetBlobsV2 Request Time tracks the duration of getBlobsV2 requests issued to the execution client. Timely blob retrieval is required for block validation and data availability checks, and execution-layer delays directly propagate to consensus performance.
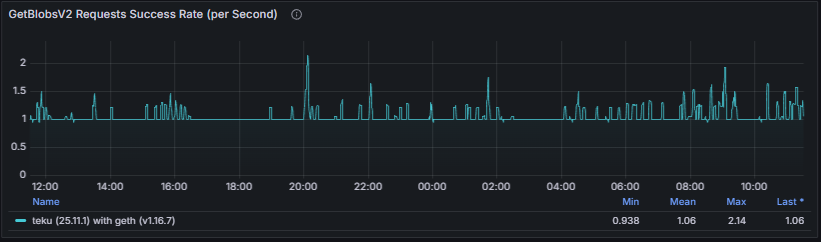
GetBlobsV2 Request Success Rate measures the ratio between issued getBlobsV2 requests and received responses. A sustained mismatch indicates impaired consensus–execution communication and may lead to missed blobs and block processing failures.
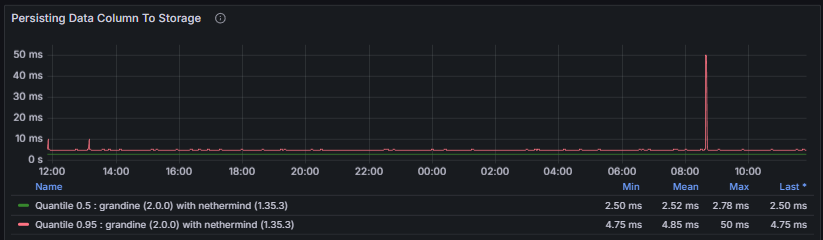
Grandine specific metrics
Grandine exposes additional metrics related to sidecar data persistence and background task efficiency. Persisting Data Columns to Storage tracks the end-to-end duration of the task responsible for persisting data column sidecars to durable storage.
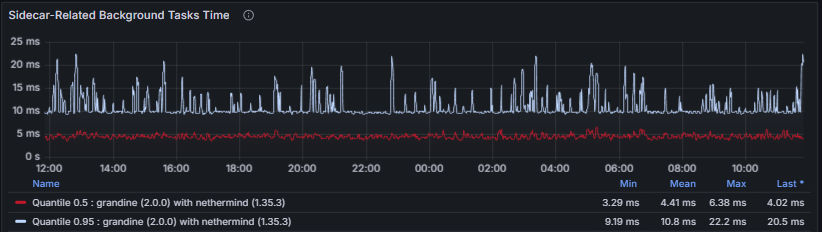
Sidecar-Related Background Tasks Time measures the execution time of background tasks involved in handling data column sidecars.
3.4 Networking
The Networking metrics section provides an overview of the peer-to-peer communication layer performance, focusing on connection stability, bandwidth usage, and peer behavior across different transports and clients.
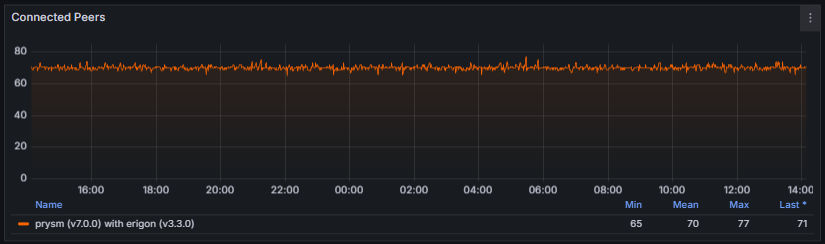
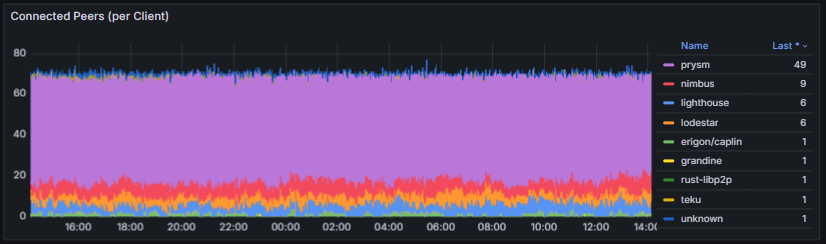
- Connected Peers and Clients: Track the number of active peer connections and their distribution among consensus clients (e.g., Lighthouse, Teku, Prysm, Nimbus). Stable values indicate a healthy and well-connected node within the network.
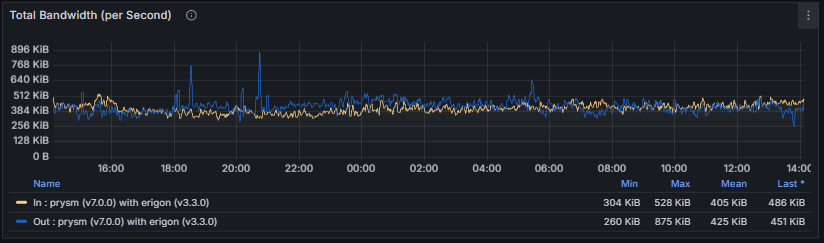
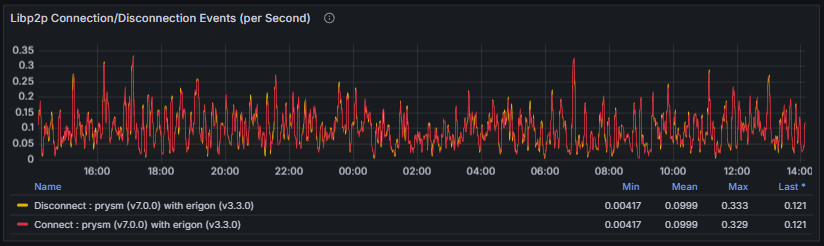
- Libp2p Bandwidth and Connection Events: Show inbound and outbound traffic levels as well as connection churn over time. These metrics help evaluate communication throughput and identify potential congestion or connection instability.
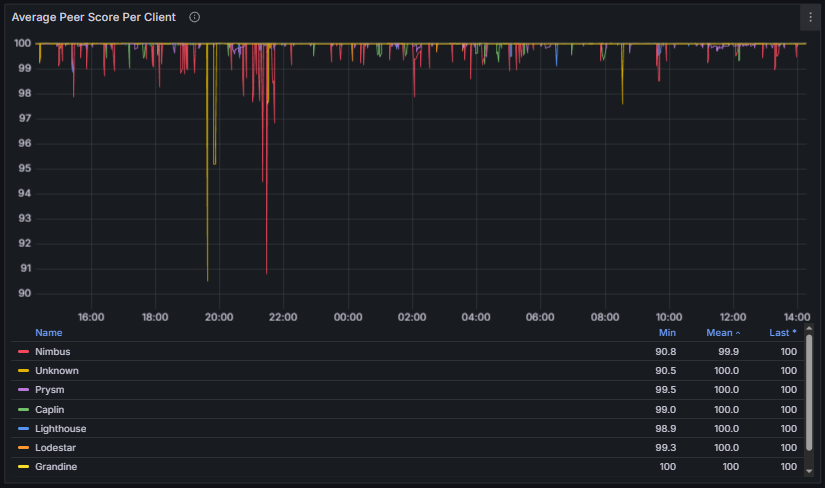
- Peer Score: Represents the reputation of a connected peer and reflects the reliability of its behavior in gossip and protocol-level interactions. Each consensus client implements its own scoring logic and accounting model, but scores are generally adjusted dynamically based on factors such as message validity, timeliness, delivery rate, and penalties for misbehavior.
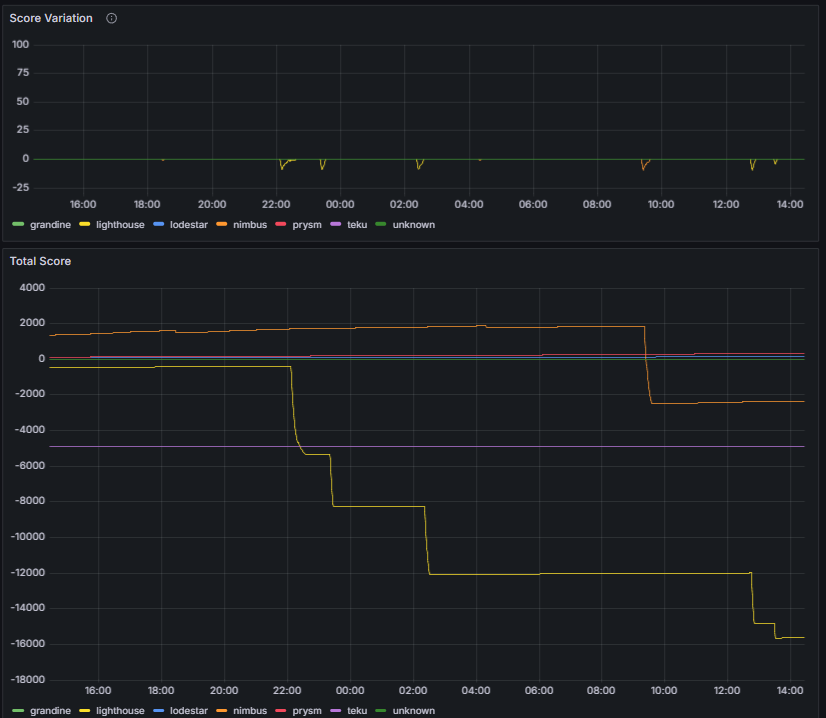
Some clients expose the peer score as a cumulative counter tracking the total score over time. Because this representation can obscure recent negative behavior, a score variation chart is used to highlight short-term changes and facilitate the identification of recently misbehaving peers.
Together, these metrics provide a holistic view of networking efficiency, connection resilience, and overall peer behavior across the libp2p layer.
3.5 libp2p / GossipSub
The libp2p/GossipSub section describes how the node performs peer-to-peer communication at the networking layer. It covers direct RPC interactions, participation in gossip topics, maintenance of the GossipSub mesh, and the application of flow-control mechanisms designed to preserve network stability and efficiency.
Monitoring these metrics is essential for assessing network connectivity, message propagation reliability, and peer behavior. Degradations at this layer directly affect block and attestation dissemination, blob availability, and overall consensus performance. Persistent anomalies (elevated RPC error counts, low peer participation in gossip topics, excessive gossip rejections) often indicate peer misbehavior, client incompatibilities, or local resource constraints, and should be investigated promptly to maintain node correctness and liveness.
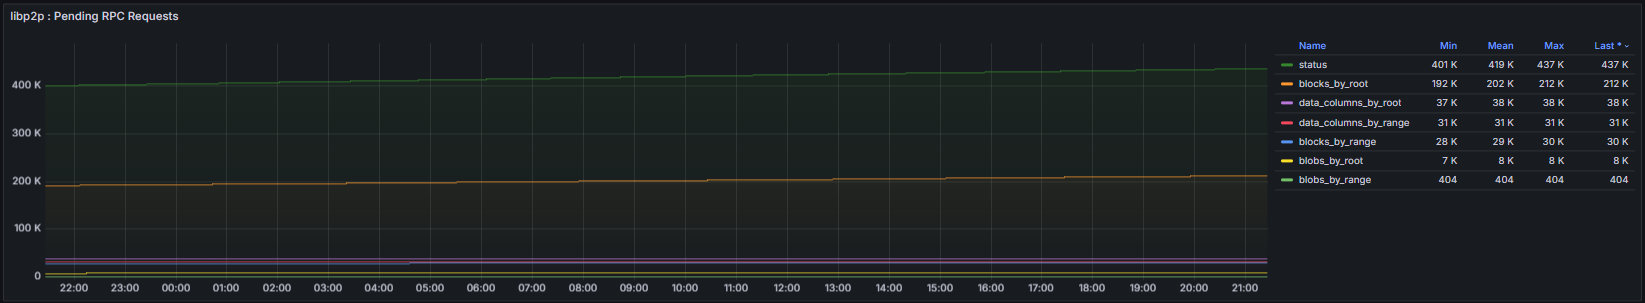
Libp2p RPC Requests counts the total number of libp2p RPC requests initiated or handled by the node. These RPCs are used for direct peer-to-peer protocol interactions outside of the gossip layer, including status exchanges, block and blob requests, and metadata queries.
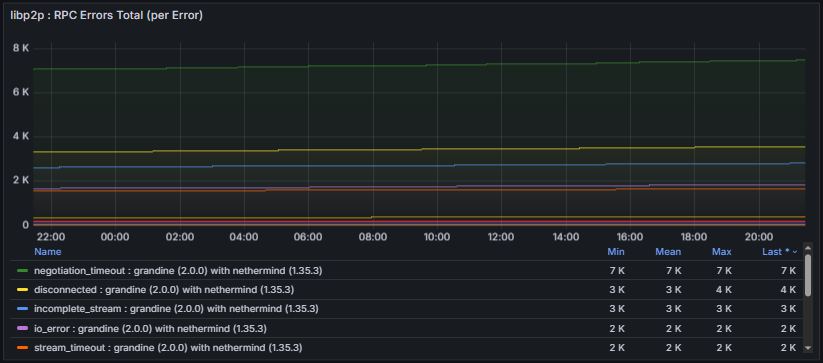
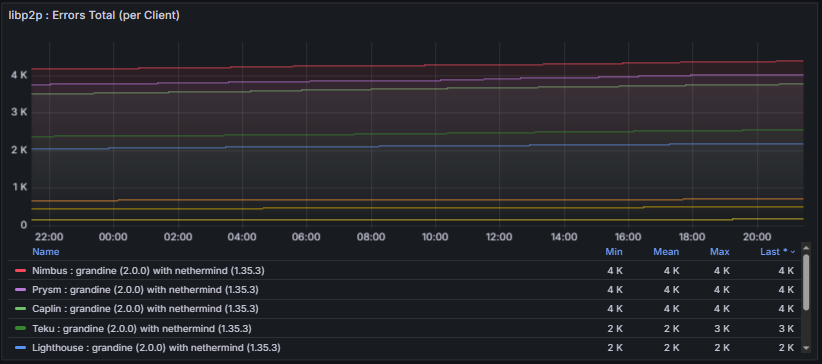
Libp2p Errors Total tracks failures observed during libp2p RPC interactions with peers and provides visibility into communication reliability and protocol-level compatibility.
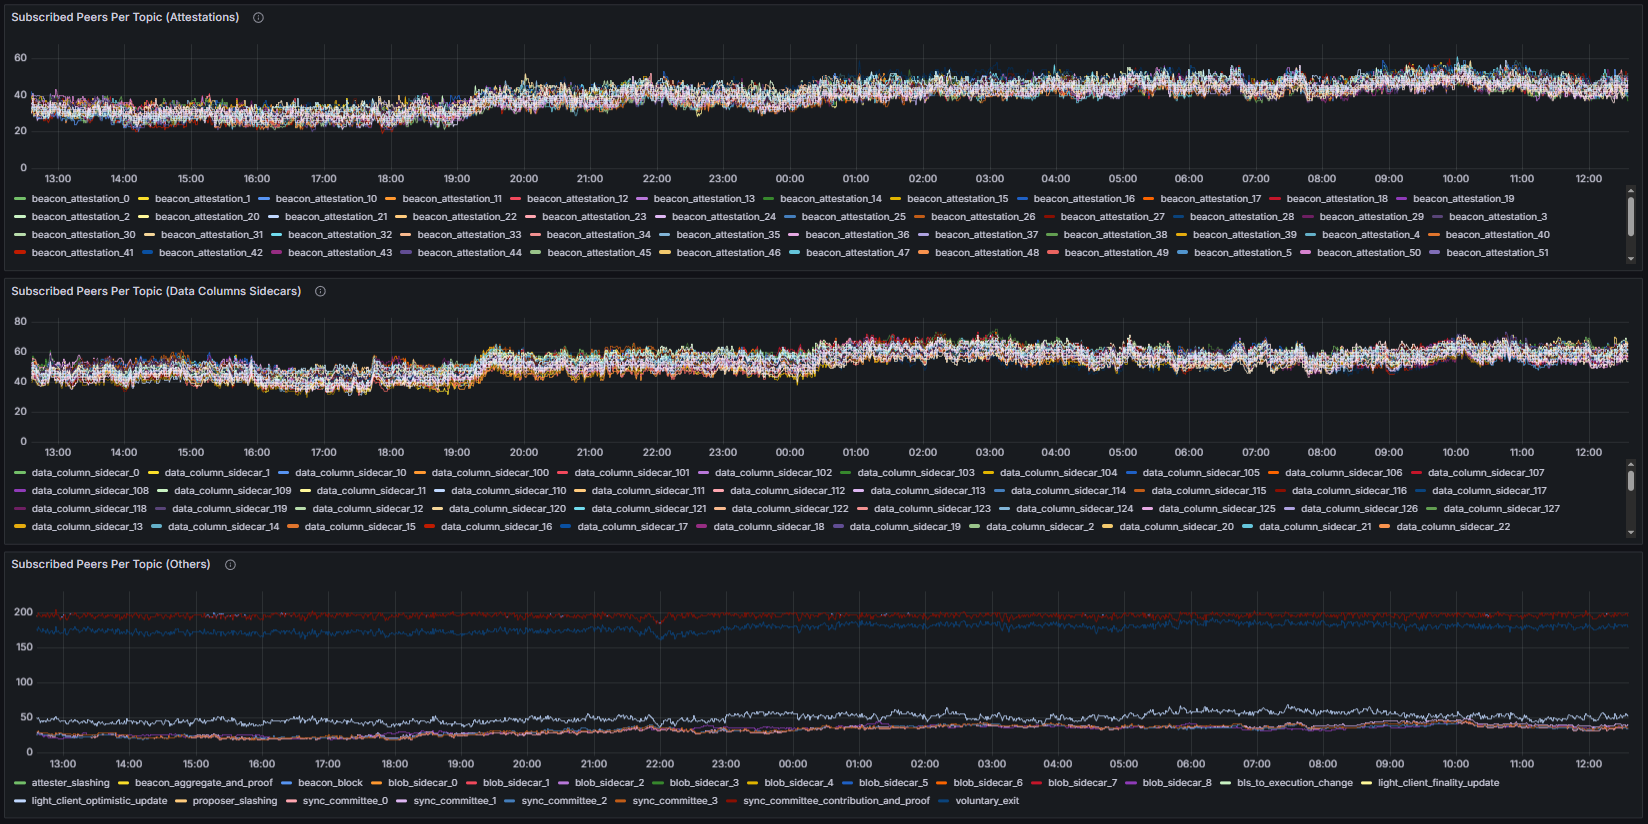
Subscribed Peers per Topic reports the number of peers connected to each GossipSub topic. To improve readability given the large number of topic values exposed by some clients, the graphical representation of this metric applies two transformations. First, values are aggregated by topic while ignoring the fork digest identifier. This requires additional Grafana transformations to extract and retain only the topic name, which is also reflected in the graph legend. This transformation maps the raw topic identifiers into a normalized topic view.
- Before:
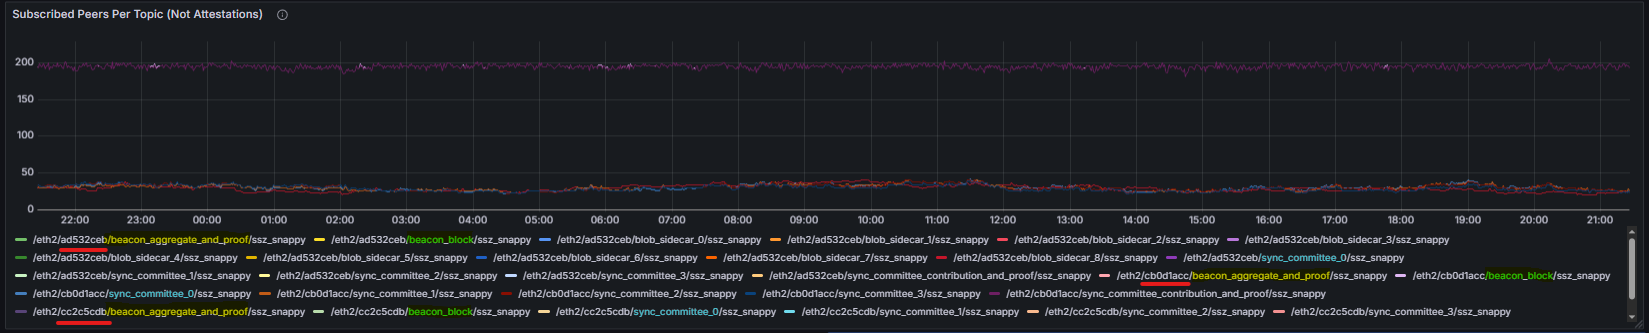
- After:
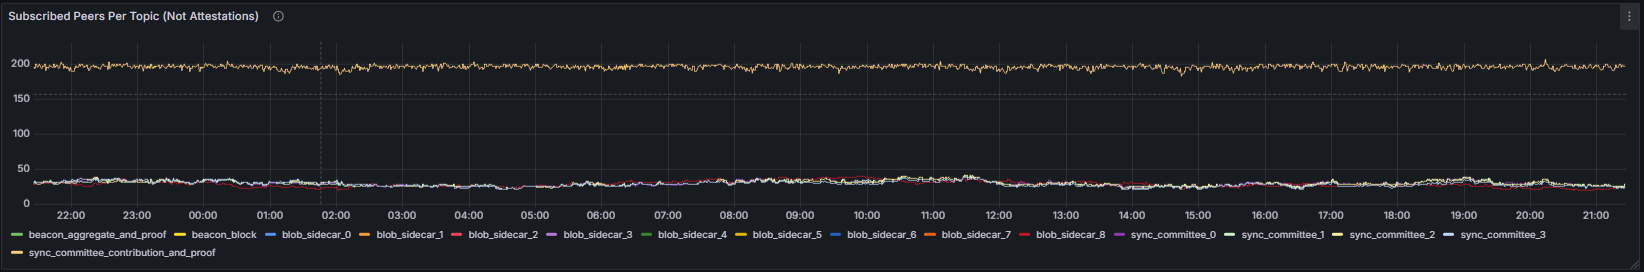
Second, the resulting chart was split into three groups: Beacon Attestations, Data Column Sidecars and all other topics.
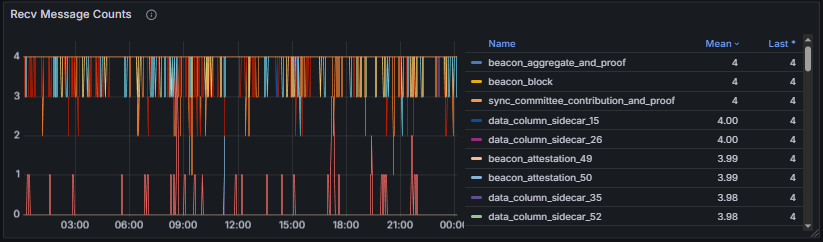
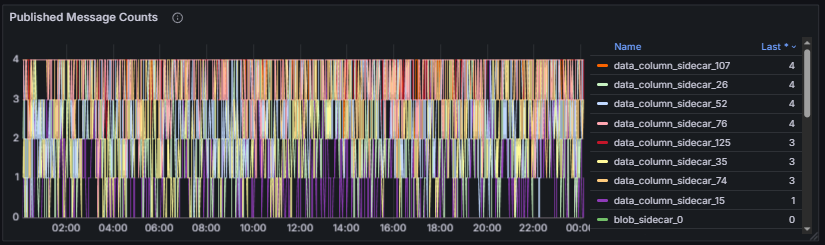
Received / Published Message Total counts the total number of messages received and published by the node per GossipSub topic, providing insight into message flow and gossip participation.
Mesh Peers reports the number of peers currently participating in the node’s GossipSub mesh across all subscribed topics and reflects the robustness of the gossip overlay. To facilitate the analysis, this metric was also partitioned into three categories: Attestations, Data Column Sidecars, and other elements.
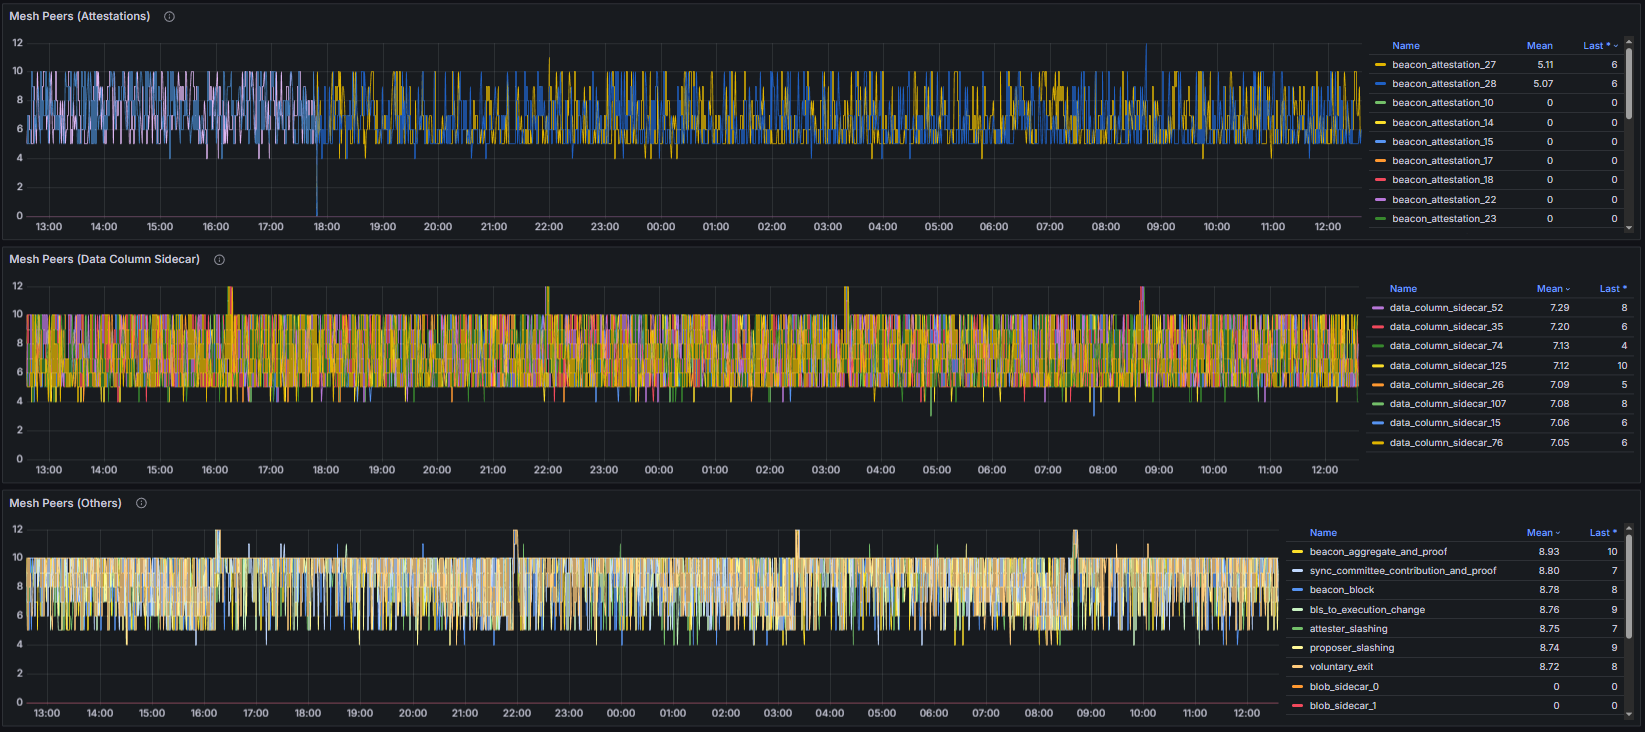
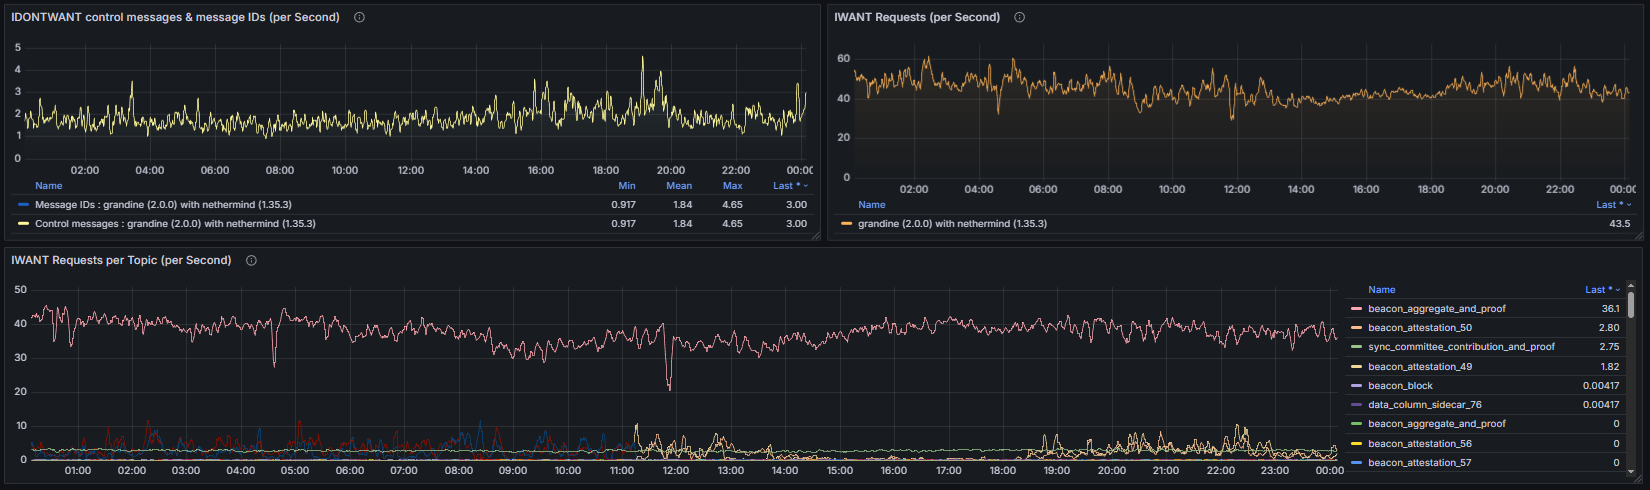
Finally, the IWANT / IDONTWANT metrics expose the number of requests exchanged with peers to retrieve missing messages or reject duplicate or undesired messages, offering visibility into gossip repair activity and flow-control behavior.
Together, these measurements provide a comprehensive view of how the libp2p and GossipSub protocols maintain connectivity, handle network load, and ensure consistent and reliable message dissemination across clients and topics.
3.6 Discv5
In this section, the Discovery v5 (discv5) metrics provide visibility into the behavior and efficiency of the peer discovery subsystem. Discv5 is based on the Kademlia distributed hash table (DHT) and is responsible for locating peers, maintaining routing information, and enabling nodes to establish and refresh peer connections in a decentralized manner.
Monitoring these metrics is essential for assessing peer discovery effectiveness, network reachability, and churn handling. Abnormal patterns may indicate discovery failures, insufficient routing information, or degraded connectivity, which can ultimately impact the node’s ability to sustain a healthy peer set.
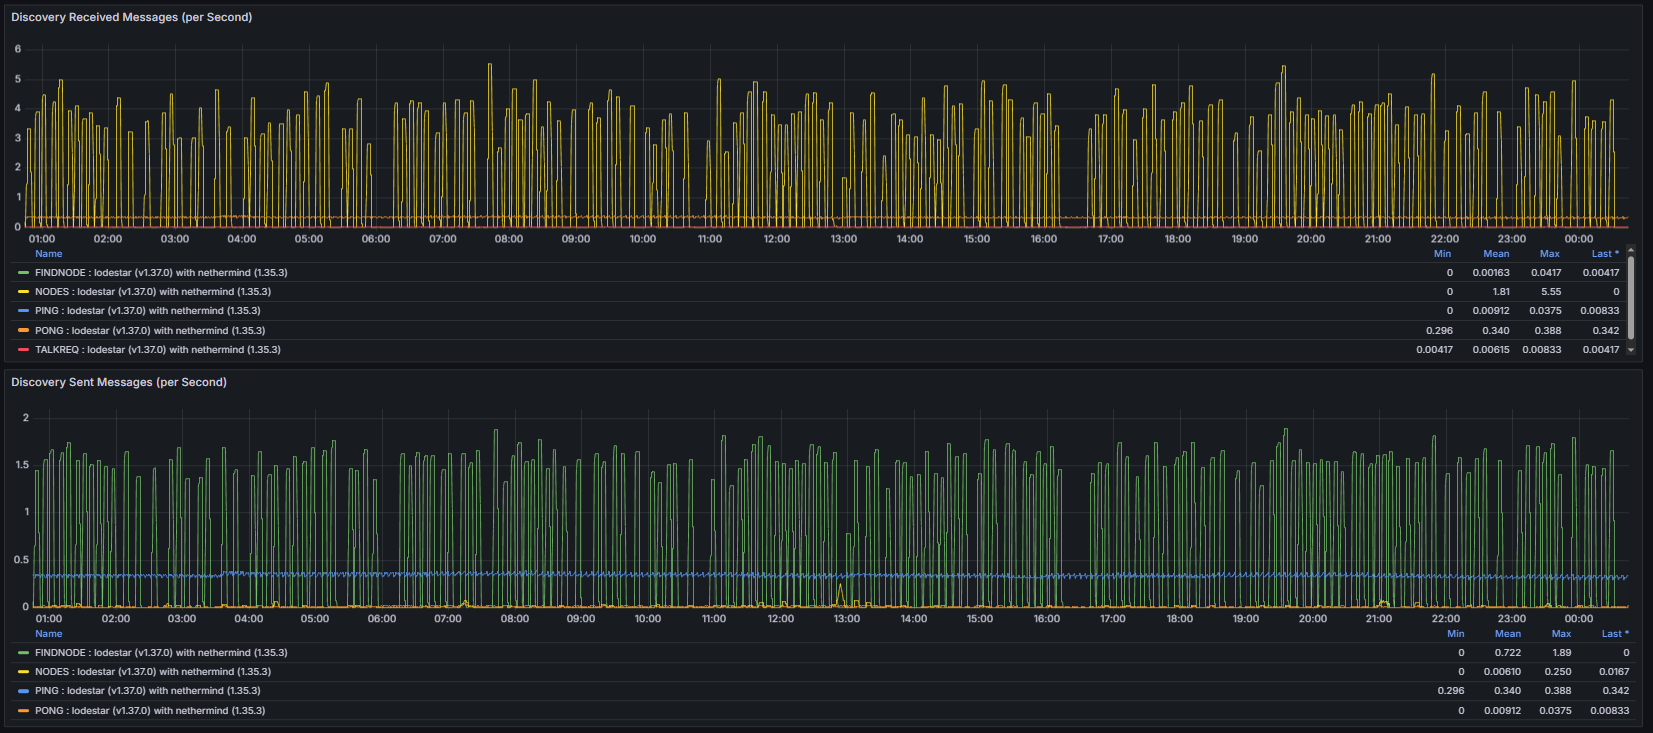
Sent / Received Messages measure the number of discv5 protocol messages exchanged with other nodes. These messages include discovery queries and responses and reflect overall discovery traffic and protocol activity.
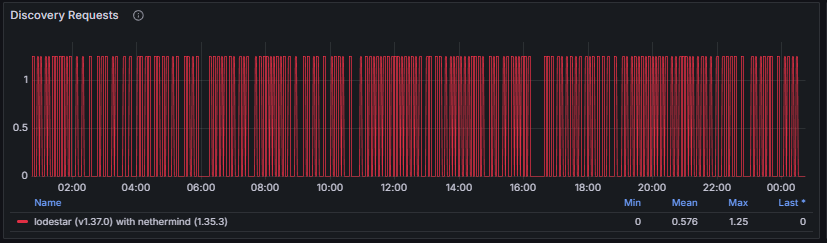
Discovery Requests track the number of peer discovery queries initiated by the node. These requests are used to locate new peers or refresh existing routing information and are expected to occur continuously as part of normal network operation.
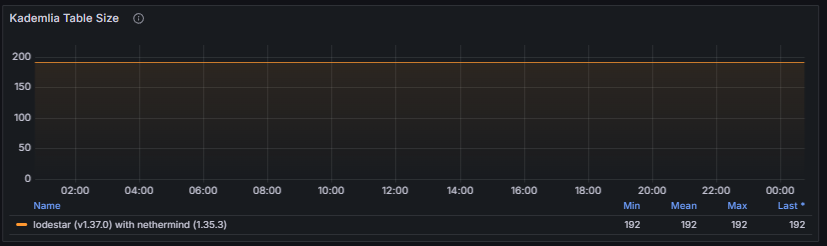
Kademlia Table Size reports the number of peer records currently stored in the node’s Kademlia routing table. This table contains information about discovered peers, organized by distance in the node ID space, and is used to efficiently route discovery queries. A healthy Kademlia table maintains a sufficiently large and diverse set of peers, enabling effective discovery while avoiding excessive churn or stale entries.
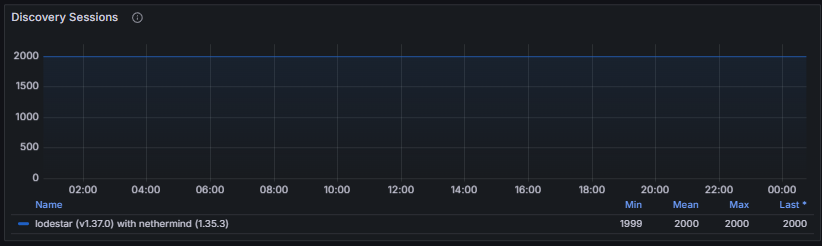
Discovery Sessions measure the number of active or completed discovery processes running concurrently. These sessions represent ongoing attempts to discover peers and update the routing table and provide insight into how aggressively the node is engaging in peer discovery.
Together, these metrics allow operators to evaluate the health and effectiveness of the Discovery v5 subsystem, ensuring that the node can consistently discover peers, maintain an up-to-date routing table, and support robust connectivity across the network.
3.7 Storage
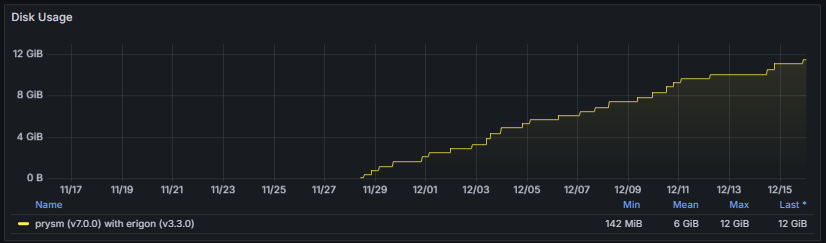
The Storage section provides visibility into the node’s database footprint, including the total size of all persisted data. This encompasses blockchain state, beacon chain data, data column sidecars, blobs, and any additional metadata maintained by the client.
Monitoring storage metrics is essential to ensure that the node has sufficient disk capacity for ongoing operation. Excessive or rapidly growing storage usage may indicate misconfigurations, unusually high network activity, or inefficient pruning. Maintaining an optimal database size is critical for node performance, startup times, and long-term reliability.
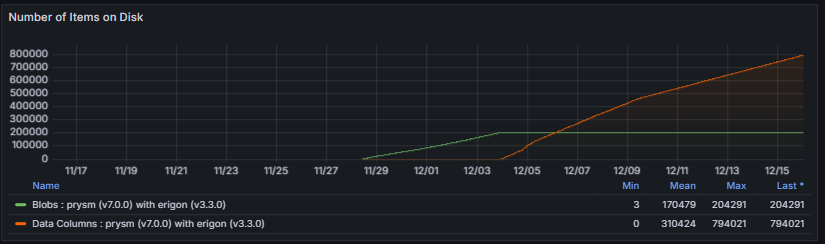
These metrics help evaluate data growth patterns, storage efficiency, and the overall health of the node’s persistence layer, ensuring reliable long-term operation and optimal performance.
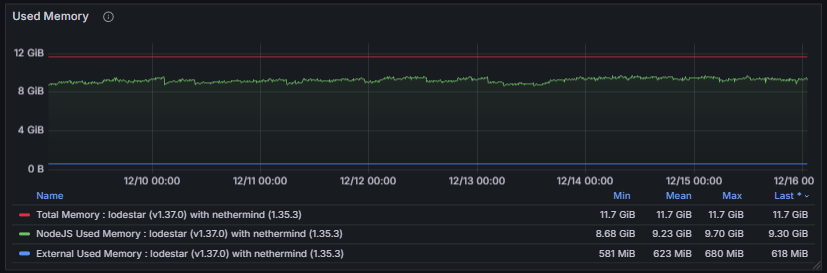
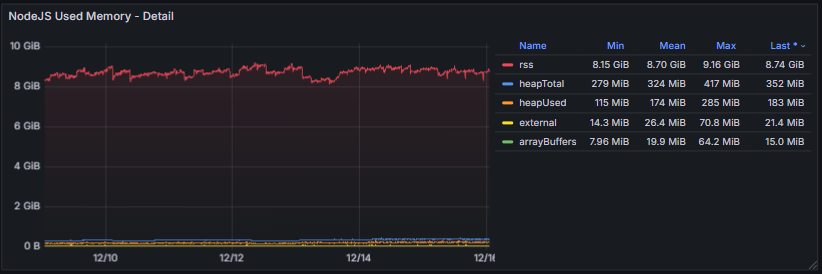
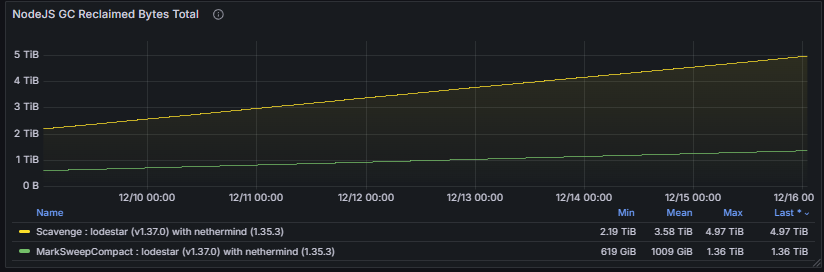
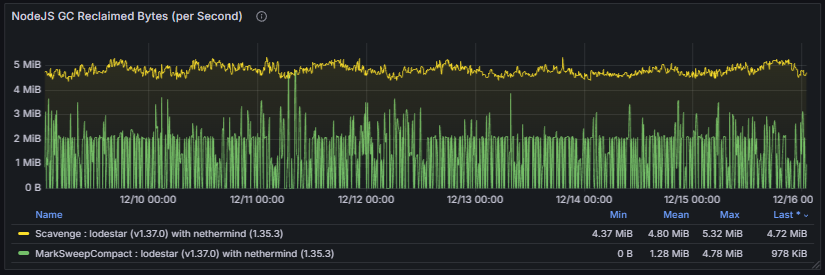
3.8 Language-Specific Metrics
The Language Specific Metrics section focuses on the runtime environment of the node, including memory usage and garbage collection (GC) processes. These metrics track heap and non-heap memory consumption, allocation rates, and GC frequency or duration.
Monitoring these metrics is important to detect memory pressure, leaks, or performance bottlenecks caused by excessive GC activity. Healthy behavior is characterized by stable memory usage with predictable, short-duration GC cycles. Unusually high memory consumption or frequent long GC pauses can impact consensus participation, block processing, and overall client stability.
Change control for this page: material edits will be logged in the global Changelog with a short rationale and effective date.