System Resource Utilization Dashboards
This page defines the standardized structure for Stereum’s System Resource Utilization dashboards, outlining the resource consumptions required for each implementation and the guiding principles that ensure cross-client consistency and comparability.
1. Introduction
This document defines the structure of a set of dashboards designed to present general system resource metrics for environments where an Execution Client and a Consensus Client operate together. It also outlines two additional dashboards intended to facilitate comparative analysis between different client combinations. All dashboards are intended for integration into the Stereum monitoring ecosystem, extending its observability capabilities with standardized and comparable system-level insights.
2. System Resource Utilization (EL & CL)
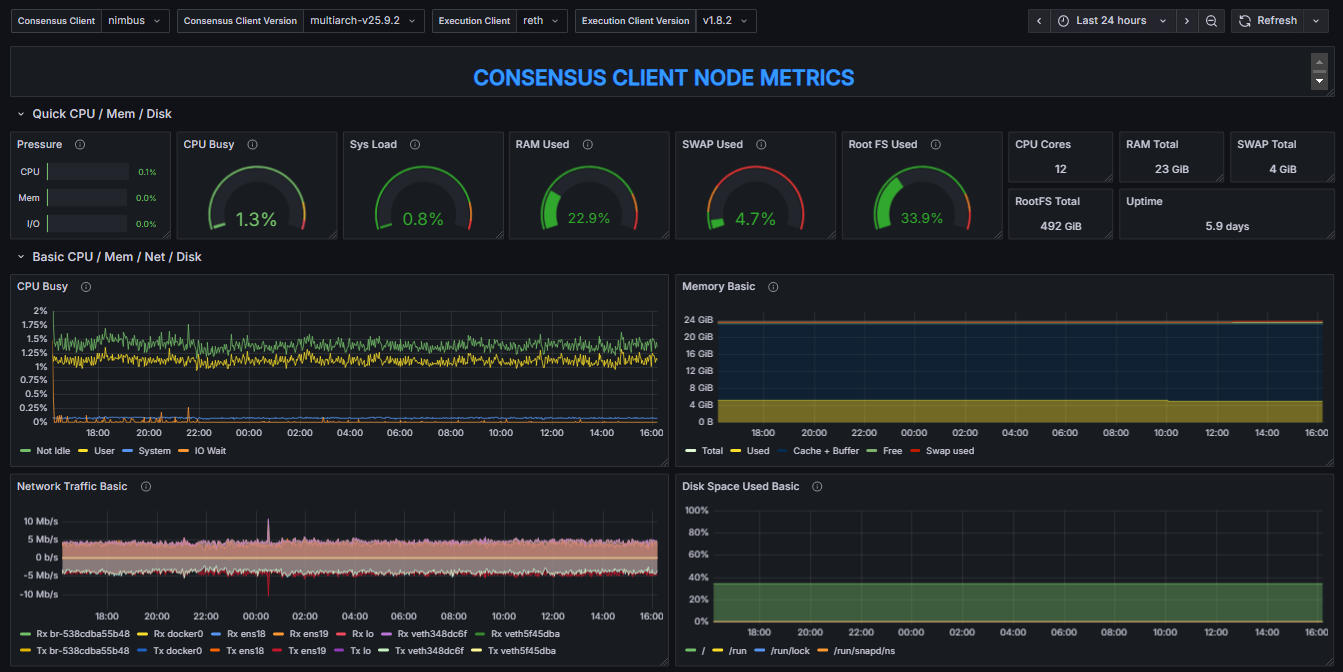
This dashboard provides an overview of key system performance indicators. It displays real-time information about resource utilization, including CPU usage, system load, memory (RAM), and disk usage, among others. Additionally, it includes time-series charts that visualize the evolution of these metrics, offering a more comprehensive understanding of system behavior and trends over time.
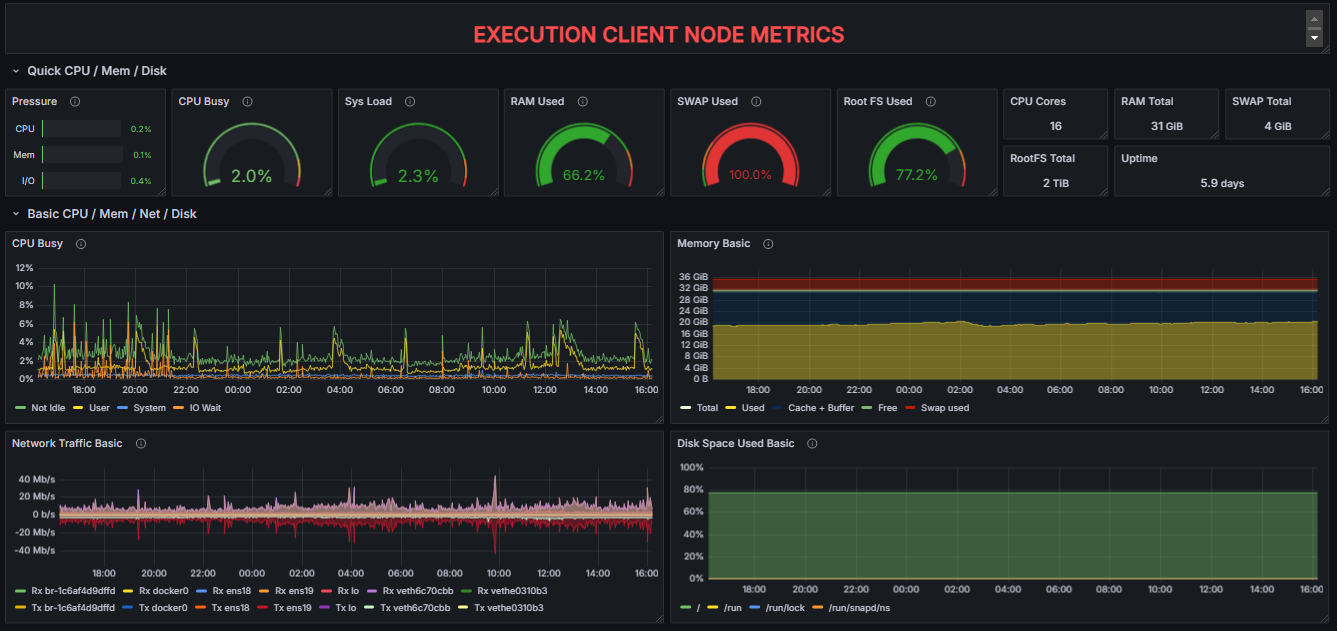
Because both the Consensus Layer (CL) and Execution Layer (EL) nodes are monitored, the dashboard is divided into two sections, each presenting the same set of metrics for their respective nodes. This layout facilitates direct observation and comparison of performance characteristics between the two layers.
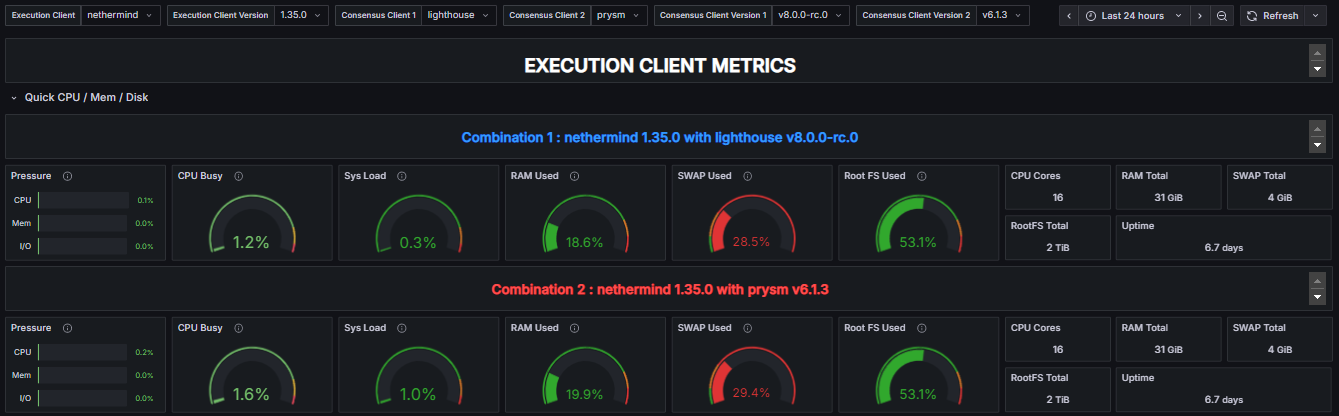
At the top of the dashboard, users can select the CL/EL node combination to be displayed. When multiple client versions are available, the desired version can be selected manually. If only one version is present, the dashboard automatically uses the available one by default.
![]()
Many of the displayed metrics are calculated over a specific time interval, which is automatically adjusted by Grafana according to the selected time range of the time-series charts. When a time range shorter than 24 hours is selected, the resulting intervals may become too narrow. In cases where data points are missing within these short intervals, this can lead to query errors or empty visualizations. To ensure stable and accurate metric representation, it is recommended to maintain a minimum time range of 24 hours when analyzing data.
![]()
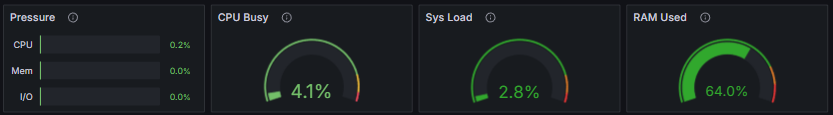
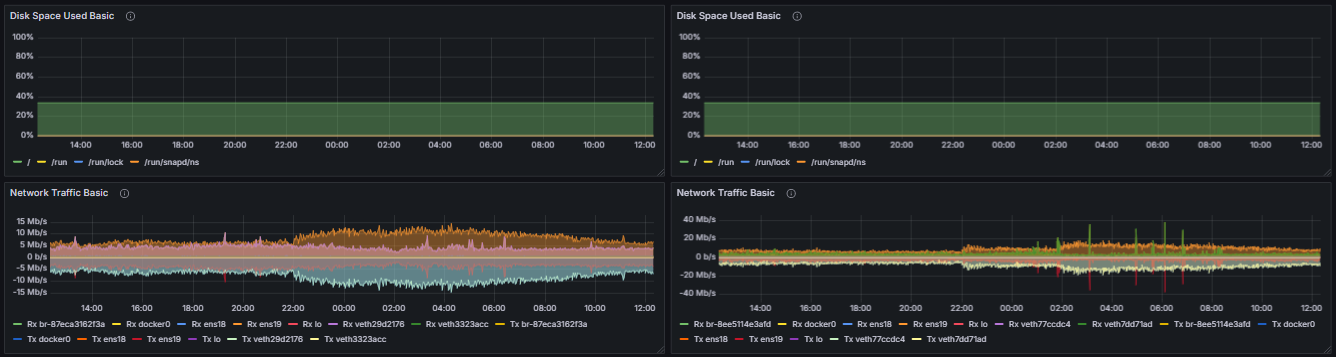
For both clients, the metrics are divided into two sections, the latest computed values:
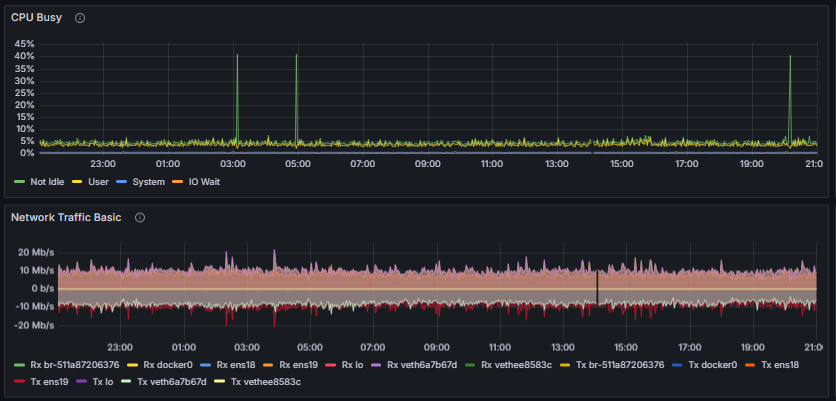
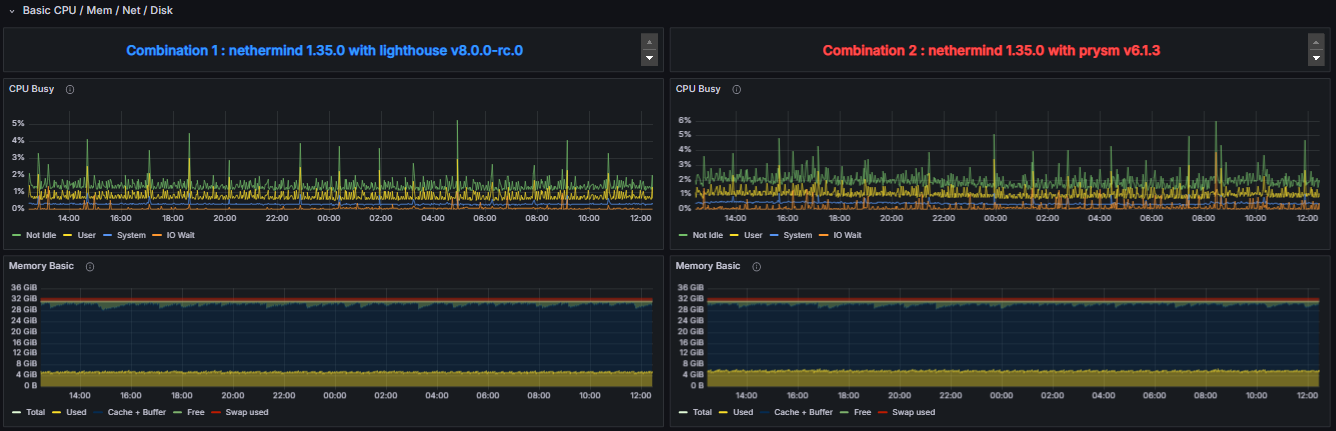
And the time-line charts:

Charts Explained

Pressure Stall Information (PSI) metrics in Linux. Provides insights into resource utilization by measuring the pressure on the CPU, Memory and I/O

Percentage of elapsed time during which the CPU is active in states other than "Idle." This encompasses all forms of active processing, including executing user and kernel processes.

Processes that are either currently executing on the CPU or are in a ready-to-run state, waiting for CPU allocation.

Amount of physical RAM actively used by applications and system processes, excluding cache and other reclaimable memory

Proportion of total allocated swap space that is currently in use by the system

Current disk space utilization of the root filesystem
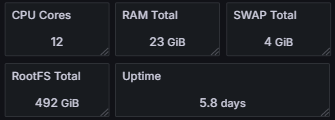
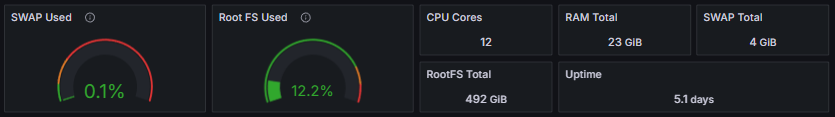
Number of CPU Cores Total RAM Total SWAP Total Root File System Space Uptime
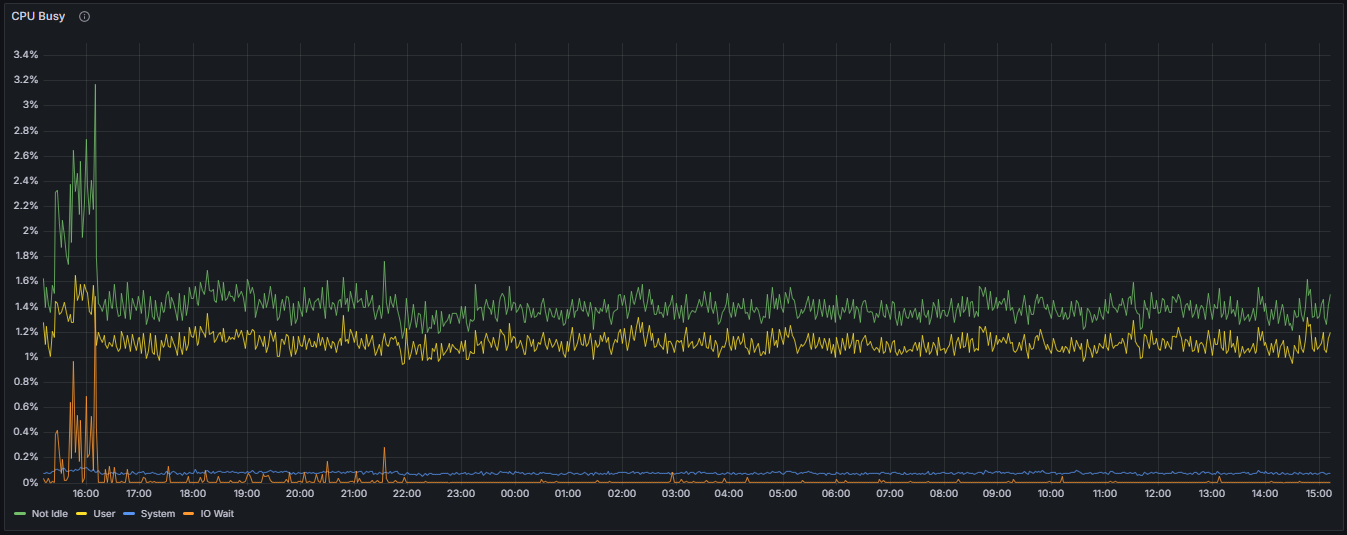
CPU Busy Time Percentage:
Represents the proportion of total elapsed time during which the CPU is actively engaged in executing tasks, excluding idle periods. This metric quantifies the extent of CPU utilization attributable to active processing tasks.
User Mode CPU Time Percentage:
Denotes the percentage of elapsed time during which the CPU executes processes in user mode. This encompasses application-level processes and user-initiated tasks, reflecting the workload initiated by user-space applications.
System Mode CPU Time Percentage:
Indicates the proportion of elapsed time in which the CPU is executing kernel or core system operations. This metric provides insight into kernel-level activity and system resource management.
I/O Wait Time Percentage:
Represents the percentage of total elapsed time during which the CPU is idle while awaiting completion of I/O operations. Elevated I/O wait times may suggest bottlenecks in disk or network I/O subsystems, impacting overall system performance.
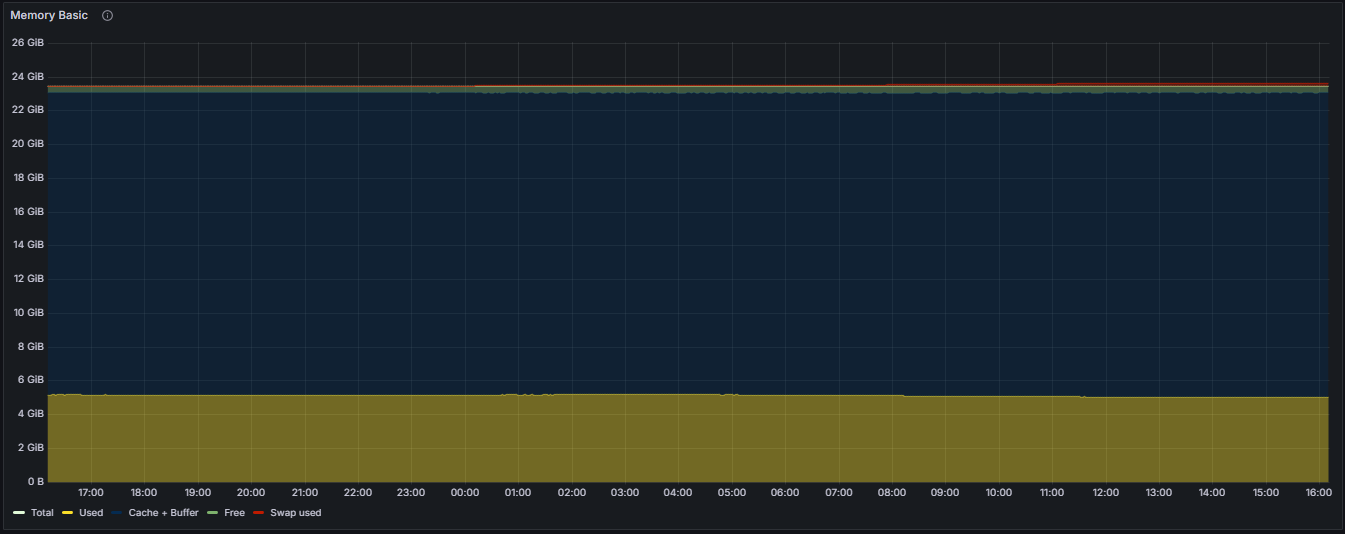
Total RAM:
The total physical memory installed within the system, serving as the overall capacity for data processing and application demands.
Used RAM:
The portion of RAM currently allocated to active processes, applications, and system services, excluding cache and buffers.
Cache + Buffer RAM:
The segment of RAM utilized for caching filesystem data and buffers, which facilitates faster data access and system performance. This represents memory used for read-ahead caching and buffer management.
Free RAM:
The amount of RAM available for allocation to new processes and applications, unoccupied by current system or application data.
Swap Space Usage:
The amount of RAM available for allocation to new processes and applications, unoccupied by current system or application data.
Swap Space Usage:
The percentage of total swap space currently engaged by the system, indicating the extent of virtual memory utilization and potential memory pressure.
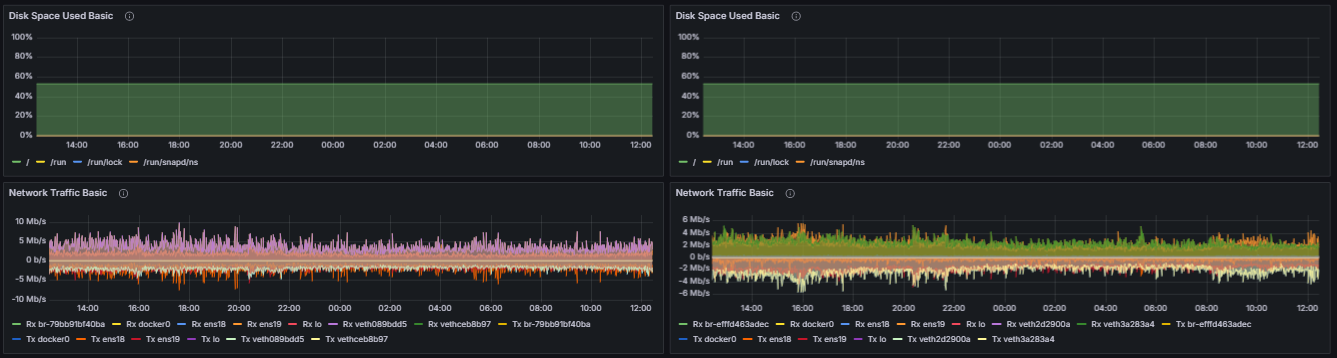
Per-Interface Network Traffic (Measured in Bits per Second)
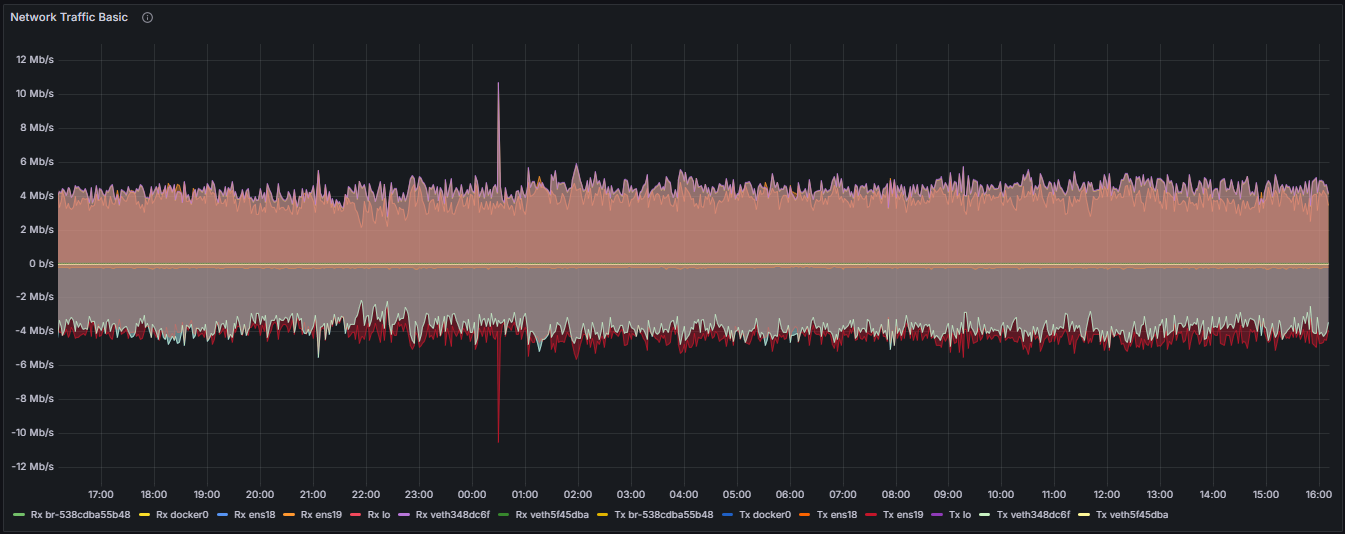
Receive Traffic (Rx):
The data throughput received by a network interface, expressed in bits per second, reflecting inbound network activity.
Transmit Traffic (Tx):
The data throughput transmitted by a network interface, expressed in bits per second, representing outbound network activity.
Filesystem Space Utilization by Mount
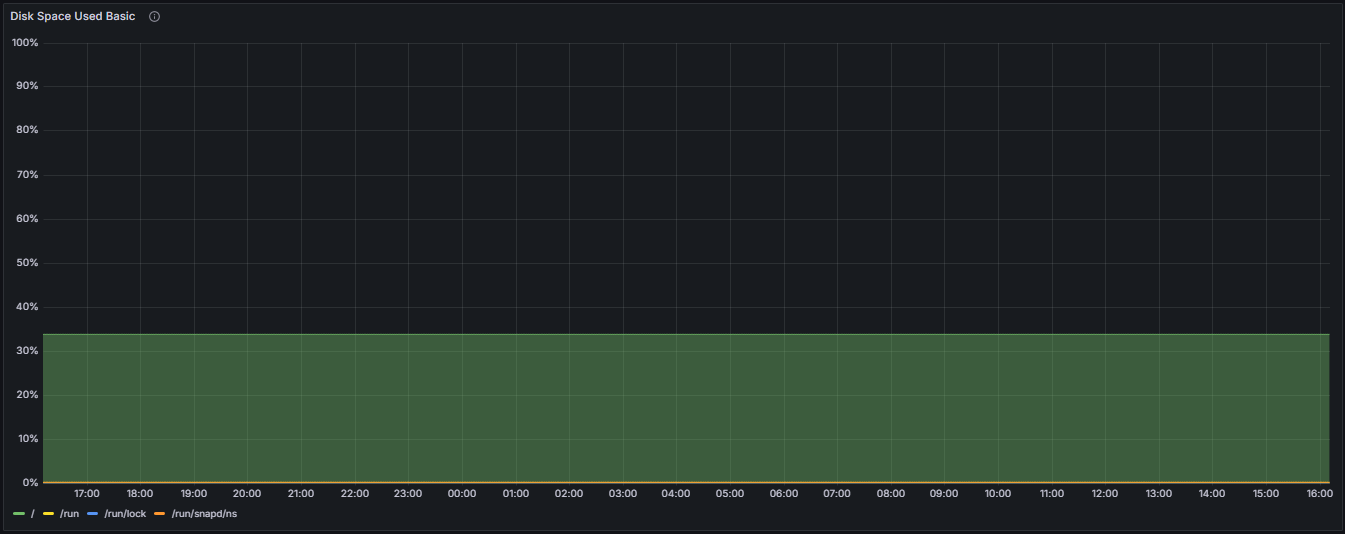
Root Filesystem (/):
The percentage of total disk space used on the root filesystem, which contains the primary operating system files and applications.
/run Directory:
The percentage of space utilized within the temporary runtime directory used for runtime variable data.
/run/lock Directory:
The space utilization of the lock directory, primarily used for filesystem-based locking mechanisms.
/run/snapd/ns Directory:
The percentage of space used within the snapd namespace directory, related to snap package management and system snap services.
Full System Resource Utilization (EL & CL) Dashboard
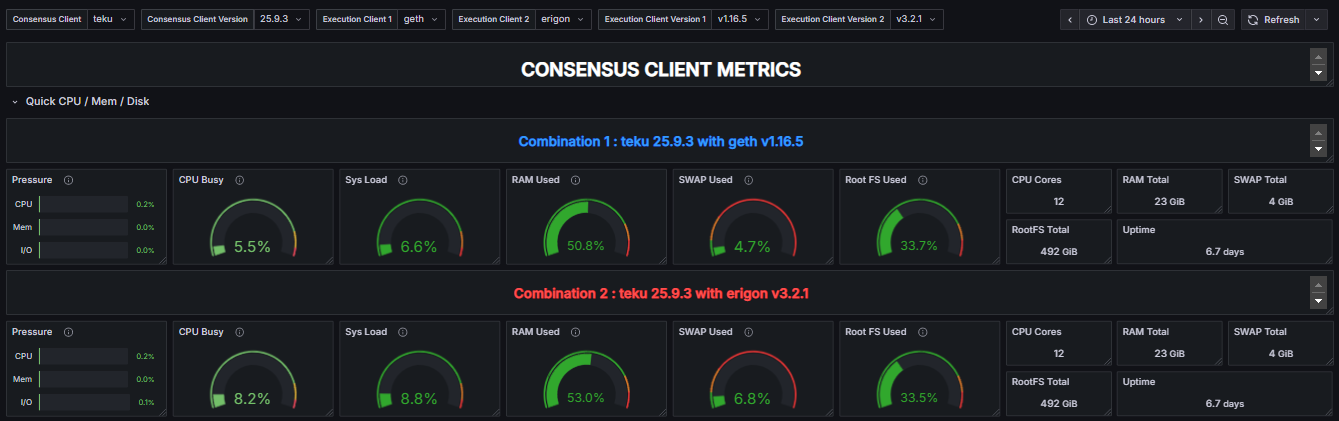
3. System Resource Utilization Comparators
To enable a detailed comparison of the performance impact of different client configurations, the “System Resource Utilization Comparator – CL” dashboard provides a specialized view derived from the “System Resource Utilization (EL & CL)” dashboard. While it contains the same underlying metrics, this comparator dashboard focuses exclusively on the performance indicators of the CL Client.
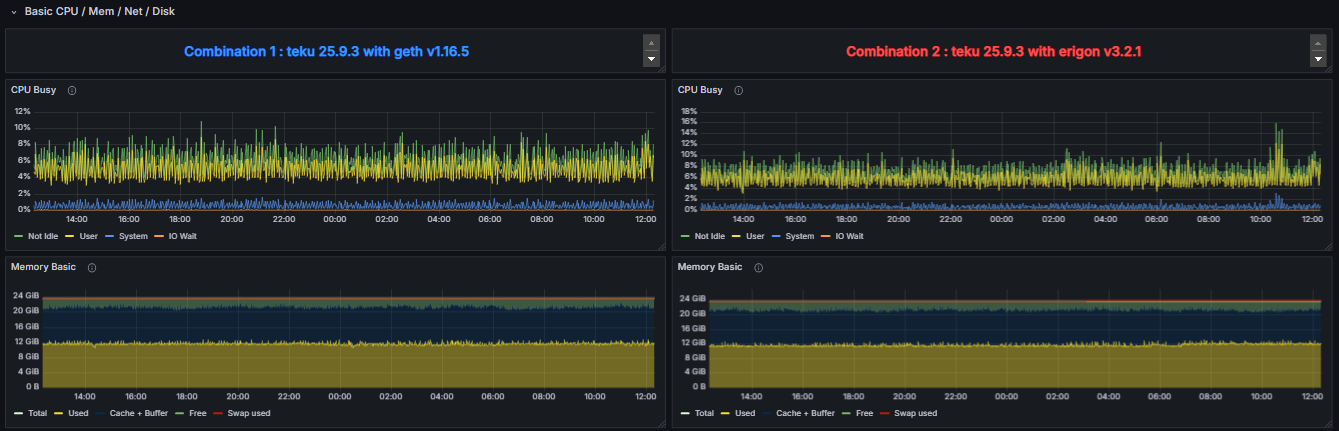
This layout is designed to facilitate a side-by-side analysis of how the same CL Client behaves when paired with two distinct EL Clients. By selecting two different execution clients in the dashboard, the metrics corresponding to the CL Client running with EL Client 1 are presented adjacent to those of the same CL Client running with EL Client 2. This direct visual comparison allows for the identification of variations in resource consumption, such as CPU, memory, disk I/O, and network, attributable to the execution layer implementation.
![]()
Similarly, the “System Resource Utilization Comparator – EL” dashboard provides an equivalent comparative view for Execution Layer Clients. In this case, the dashboard isolates and displays performance metrics related to the Execution Client when paired with two different Consensus Clients. As expected, all metrics represented in this view correspond to the Execution Layer Client itself, allowing for an in-depth evaluation of how different consensus implementations influence its performance characteristics.
![]()
Both comparator dashboards are intended to support performance benchmarking, interoperability analysis, and diagnostic evaluation between heterogeneous client pairings within an Ethereum node environment.
Full System Resource Utilization Comparator - CL Dashboard
Full System Resource Utilization Comparator - EL Dashboard
Change control for this page: material edits will be logged in the global Changelog with a short rationale and effective date.