Ethereum execution client hardware footprint, measured
· 14 min read


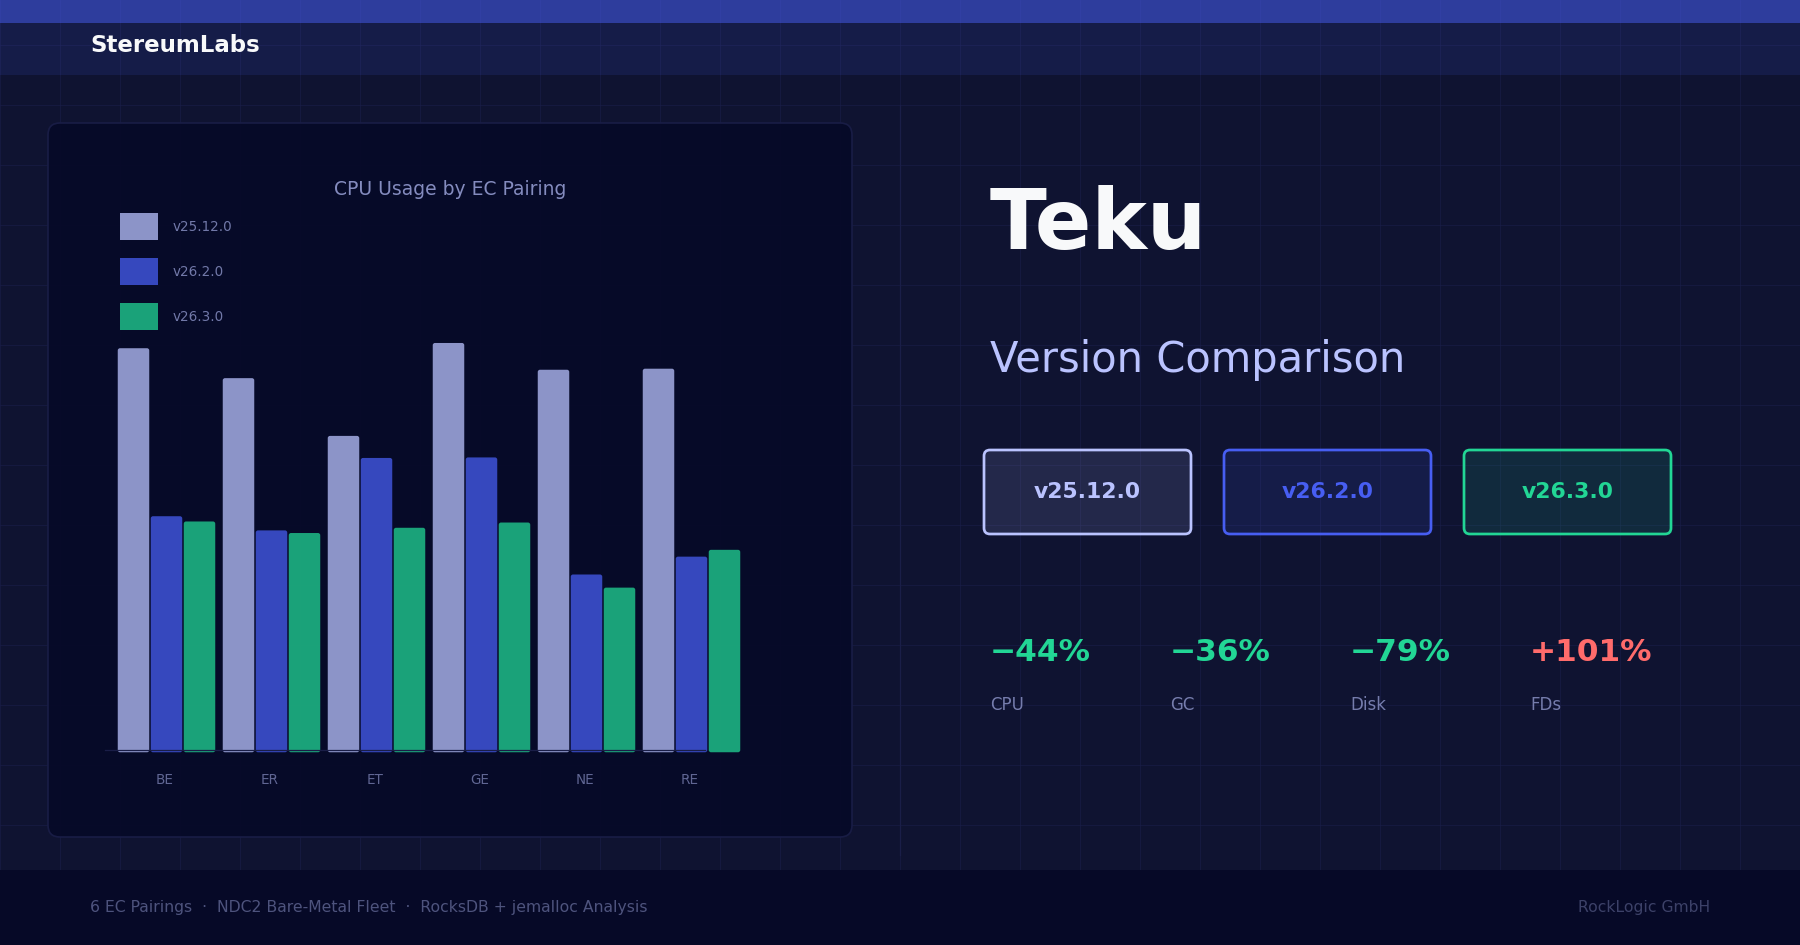
How much machine does an Ethereum execution client need once it sits at the tip of mainnet? Our fleet runs every major execution client on its own host, all with 12 cores, five of six client sets with 16 GiB RAM, one consensus client per pairing on a separate machine. Same chain, same engine-API traffic, one telemetry pipeline. Averaged over the same 36 hours, the synced clients hold between 4.9 and 15.6 GiB of host memory, burn about half a CPU core, and write to disk at anywhere from 0.9 to 22 MB/s. The spread is the story: the client you pick decides whether your box idles or works.